
Sine Wave Animation
Loading the math board and drawing, please wait…
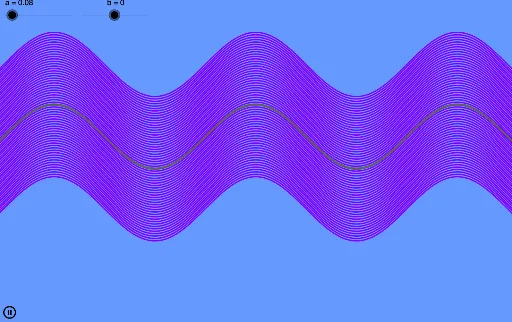
This example demonstrates an animated sine graph. It involves the core concept of the sine function, using the GeoGebra Sequence command to dynamically show the changes in the sine wave. Suitable for high school mathematics education, particularly in coordinate geometry and trigonometry.
GeoGebra Commands & Parameters
Sequence((a * n) + sin(x + (b * n)), n, -30, 30) → list1
AI Drawing Prompt Reference
Create an animated sine wave where the amplitude and phase are controlled by parameters a and b, generating a series of sine curves from n = -30 to 30 to demonstrate the dynamic changes of the sine function in coordinate geometry and trigonometry.
The prompt above was compiled from the original drawing commands and is for reference only.