
Sine Graph with Statistical Inference Integration
Loading the math board and drawing, please wait…
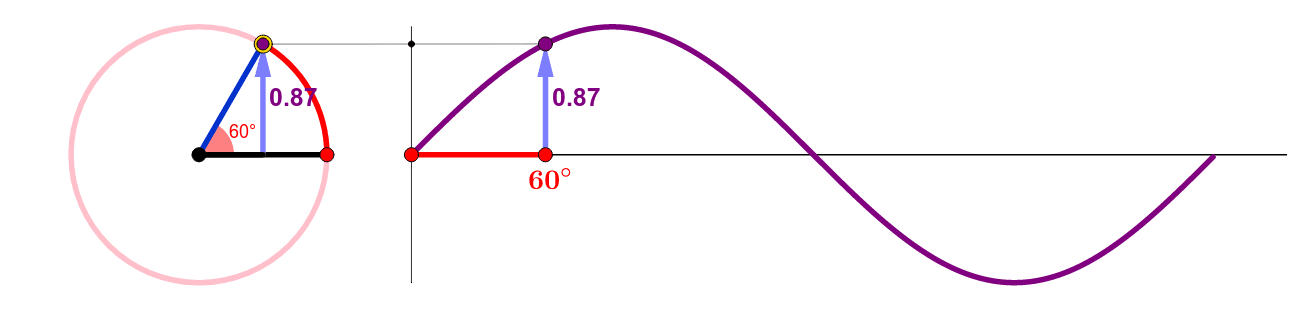
This GeoGebra example dynamically illustrates the sine function graph while integrating statistical concepts such as confidence intervals, median value, histograms, hypothesis testing, and polygons, creating a cross-disciplinary mathematical demonstration. Core mathematical concepts include the periodicity, amplitude, and phase shift of trigonometric functions, alongside statistical inference involving confidence intervals, median characteristics, and hypothesis testing procedures. Construction highlights: commands such as Point, Circle, Angle, Segment, Arc, Locus, Vector, CurveCartesian, Intersect, and Text are used to build the sine curve and related geometric objects, with sliders (e.g., θ) enabling dynamic parameter control. Suitable for high school to undergraduate mathematics education, this resource helps learners visually connect function graphs with statistical ideas and serves as an exploratory learning tool.
GeoGebra Commands & Parameters
Point(xAxis) → ACircle(A, B) → cPoint(c) → PAngle(B, A, P) → αAngle(B, A, D) → θSegment(A, D) → fArc(c, B, D) → tSegment(F, G) → hLocus(H, P) → loc1Vector(E, D) → gVector(G, H) → iCurveCartesian(0, t, t, -1, 1) → aSegment(A, B) → jSegment(P, H) → kIntersect(k, a) → IText(y(D), J + (0.03, -0.05)) → text2Text(y(D), J + (0, -0.05) + Corner[text2, 1] - Corner[text2, 2]) → text4Text(y(D), J + (0.05, -0.05)) → text5Segment(E, A) → lText(y(D), J + (0.05, -0.05) + (k, 0)) → text3
AI Drawing Prompt Reference
Draw a sine function graph and illustrate statistical inference, including confidence intervals, median values, histograms, and hypothesis testing. Use sliders to control parameters like phase shift and draw related geometric objects such as circles, arcs, and loci to demonstrate the periodicity, amplitude, and phase shift of the sine function, while integrating statistical concepts like confidence intervals and median characteristics to create a cross-disciplinary mathematical demonstration.
The prompt above was compiled from the original drawing commands and is for reference only.