
Sine Functions and Sliders Interactive Demo
Loading the math board and drawing, please wait…
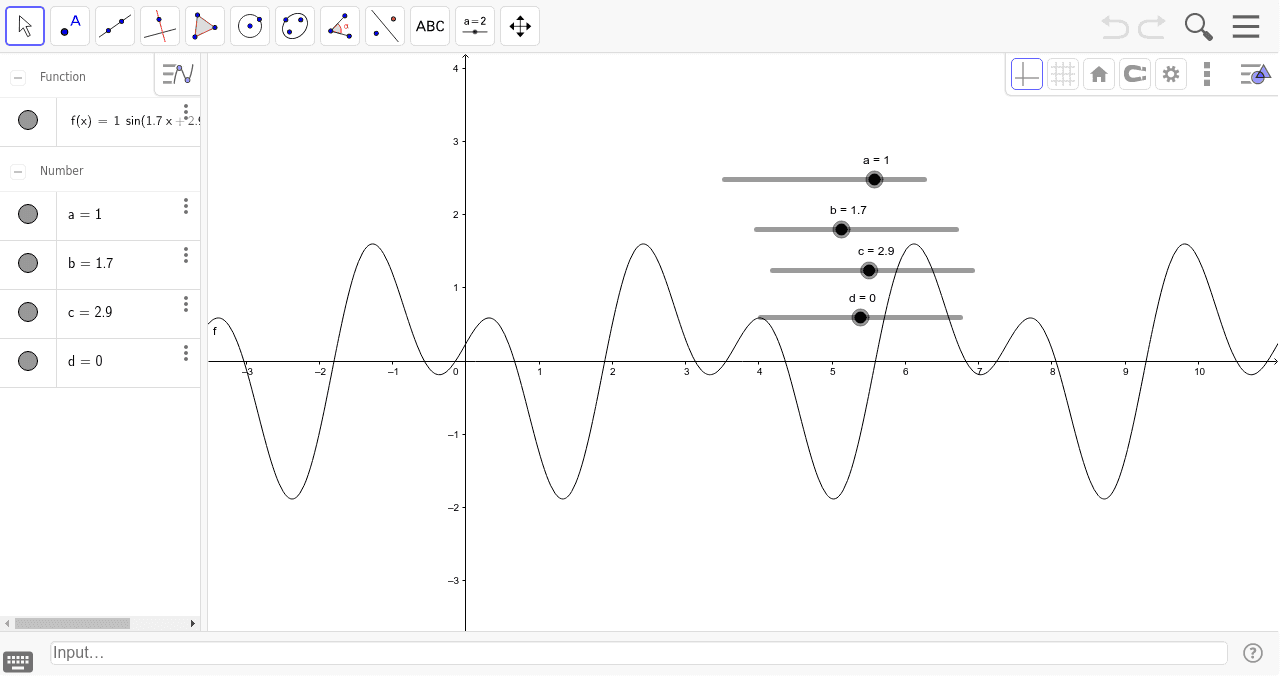
① This example demonstrates how sliders dynamically adjust parameters of sine functions, showing real-time changes in the graph. ② Core math concepts include amplitude, period, phase shift, and vertical translation of sine functions, along with comparisons to conic sections like ellipses, and extensions to kite shapes, standard deviation, and hypothesis testing. ③ Construction: GeoGebra objects a, b, c, d, f are used; sliders control parameters, function f is defined as a sine expression, and dragging sliders updates the graph instantly, possibly with conic section tools for related shapes. ④ Suitable for high school and early college students for exploring function graphs, visualizing parameter effects, and as a supplementary tool for statistics and probability topics.
GeoGebra Commands & Parameters
Numeric a(1.0)Numeric b(1.7)Numeric c(2.9)Numeric d(0.0)f(x) = (a * sin((b * x) + c)) + d + sin((2 * (b * x)))
AI Drawing Prompt Reference
Draw a dynamic sine function graph with adjustable amplitude, period, phase shift, and vertical translation using sliders. Observe real-time changes in the function f(x) = (1 * sin((1.7 * x) + 2.9)) + 0.0 + sin((2 * (1.7 * x))). Also, use ellipse tools to assist in displaying related shapes.
The prompt above was compiled from the original drawing commands and is for reference only.