
Sine Function Graph (a*sin(bx))
Loading the math board and drawing, please wait…
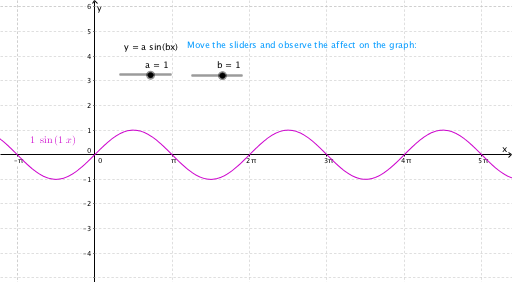
This example demonstrates the graph of the sine function a*sin(bx), showing how changes in parameters a and b affect amplitude and period. Key math concepts include trigonometric functions, function graph transformations, amplitude, and period. GeoGebra commands used: a (amplitude parameter), b (period parameter), f (function expression), text1 (text annotation), text2 (text annotation). Suitable for high school mathematics teaching, focusing on function graph drawing and property exploration.
GeoGebra Commands & Parameters
Numeric a(1.0)Numeric b(1.0)f(x) = (a * sin((b * x)))