
Cosine Rule and a*cos(bx) Function Graph
Loading the math board and drawing, please wait…
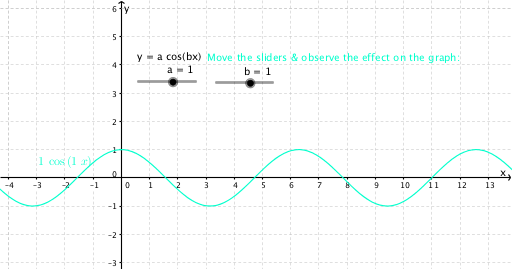
This example demonstrates the application of the Cosine Rule in triangles and shows the graph of the function a*cos(bx) with variations in parameters a and b. Core math concepts include the Cosine Rule, function graphing, and the effect of parameter changes on function behavior. Constructed using GeoGebra commands: a, b, f, text1, text2. Suitable for high school mathematics education, focusing on the integration of trigonometry and analytical geometry.
GeoGebra Commands & Parameters
Numeric a(1.0)Numeric b(1.0)f(x) = (a * cos((b * x)))
AI Drawing Prompt Reference
Draw a triangle to demonstrate the application of the Cosine Rule, and plot the graph of the function a*cos(bx) with variable parameters a and b, showing the effect of parameter changes on the function graph. First, display the triangle and the Cosine Rule formula, then plot the function graph and illustrate the changes in the function due to variations in parameters a and b.
The prompt above was compiled from the original drawing commands and is for reference only.