
Sine Function Demonstration
Loading the math board and drawing, please wait…
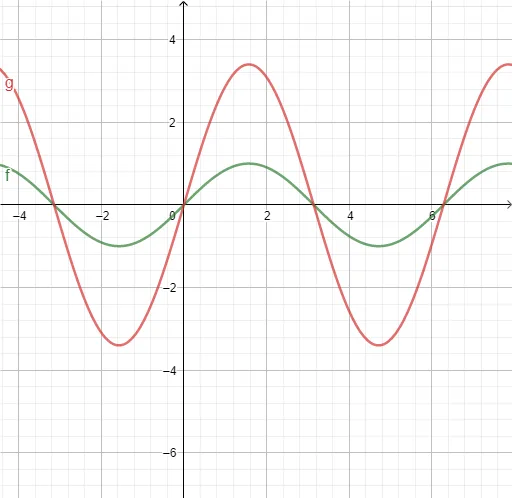
This example demonstrates the dynamic changes of the sine function graph and the effects of its parameters a (amplitude), ω (angular frequency), and φ (phase shift) on the graph. It involves core mathematical concepts such as trigonometric functions, function graphs, parametric equations, continuity, and statistical plots. Key GeoGebra commands/objects used include f (function object), a (amplitude slider), ω (angular frequency slider), φ (phase shift slider), and g (auxiliary graphic). It is suitable for high school mathematics teaching to understand the properties of sine functions and the rules of parameter changes.
GeoGebra Commands & Parameters
f(x) = sin(x)Numeric a(3.4)Numeric ω(1)Numeric φ(0)g(t) = (a * sin((ω * t) + φ))
AI Drawing Prompt Reference
Draw a sine function graph and demonstrate the effects of its amplitude, angular frequency, and phase shift parameters on the graph. Start by plotting the basic sine curve, then use three sliders to control the amplitude, angular frequency, and phase shift respectively, and use an auxiliary graphic to show the sine curve after parameter changes for observing the effects of parameters on the function graph.
The prompt above was compiled from the original drawing commands and is for reference only.