
Sine/Cosine Transformations Demo
Loading the math board and drawing, please wait…
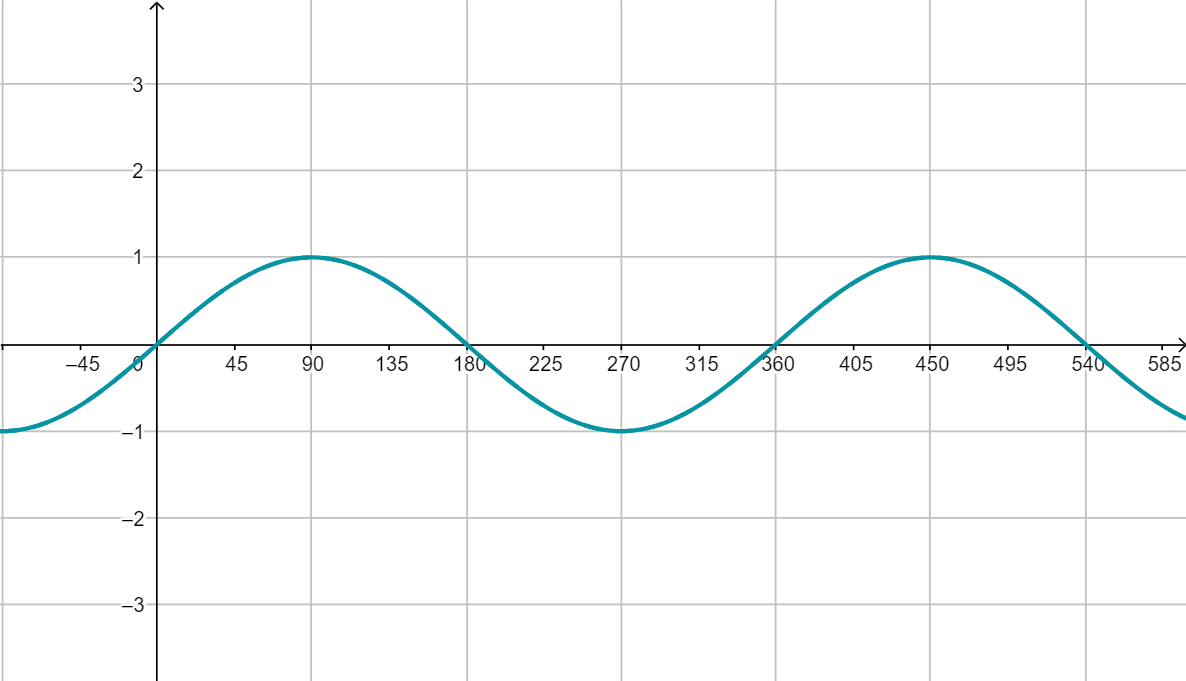
This example demonstrates the transformations of sine and cosine functions, including amplitude, phase, and period changes. It involves core mathematical concepts such as trigonometric functions, amplitude, phase, period, standard deviation, means, difference, slope, and angles. The construction uses GeoGebra commands and objects like a, b, j, c, i, d, f, g, e, h, p, q, phase, period, text1, text4 to build function graphs and parameter controls. It is suitable for high school mathematics teaching to understand trigonometric function graph transformations and their applications.
GeoGebra Commands & Parameters
Numeric a(1)Numeric b(1)(b * π / 180)Numeric c(0)(c * π / 180)Numeric d(0)f(x) = (a * sin((j * x) - i)) + dg(x) = (a * cos((j * x) - i)) + dBoolean e(true)Boolean h(false)p(x) = sin((x * π / 180))q(x) = cos((x * π / 180))c / b360 / b
AI Drawing Prompt Reference
Draw a demonstration of sine and cosine function transformations, showing amplitude, phase, and period changes. Include basic sine and cosine function graphs with transform effects controlled by parameters like amplitude, phase angle, and vertical shift. Compare standard sine and cosine functions with transformed versions, and label key parameter values and function expressions.
The prompt above was compiled from the original drawing commands and is for reference only.