
Sine, Cosine, Tangent 0°–90° Interactive Visualization
Loading the math board and drawing, please wait…
In collections
Right Angled Triangles
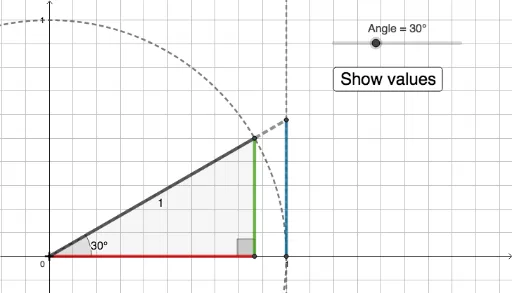
①This GeoGebra example demonstrates the graphical relationships among sine, cosine, and tangent functions for angles from 0° to 90° through an interactive dynamic construction. ②Core mathematical concepts include the right-triangle definitions of trigonometric ratios (opposite, adjacent, hypotenuse), the unit-circle interpretation, and how these ratios vary with angle. ③Construction highlights: using GeoGebra commands such as Polygon, If, Intersect, and Segment to build a right triangle, with an Angle object and a slider/button (button1 controlling variable n) to dynamically change the angle; text objects (text1–text6) display real-time function values, while function graphs (f, g, h) show the curves of sine, cosine, and tangent. ④Suitable for middle-to-high school students, this tool is ideal for introductory trigonometry lessons, comparing function graphs, and visualizing the relationship between angles and trigonometric ratios.
GeoGebra Commands & Parameters
Polygon(B, O, A) → t1, a, b, oIf(0 ≤ Angle ≤ 90°, Angle[A, B, O], If[90° < Angle ≤ 180°, Angle[O, B, A], If[180° < Angle ≤ 270°, Angle[A, B, O], Angle[O, B, A]]]) → βIntersect(c, f, 1) → DIf(0 ≤ Angle ≤ 90°, Ray[O, A], If[90° < Angle ≤ 270°, Ray[A, O], Ray[O, A]]) → gIf(0 ≤ Angle ≤ 90°, Angle[D, O, A], If[90° < Angle < 180°, Angle[D, O, A], If[180° ≤ Angle < 270°, Angle[D, O, A], Angle[D, O, A]]]) → γIntersect(f, g) → CSegment(D, C) → hSegment(O, C) → i