
Sine and Cosine Table: Geometric and Trigonometric Visualization
Loading the math board and drawing, please wait…
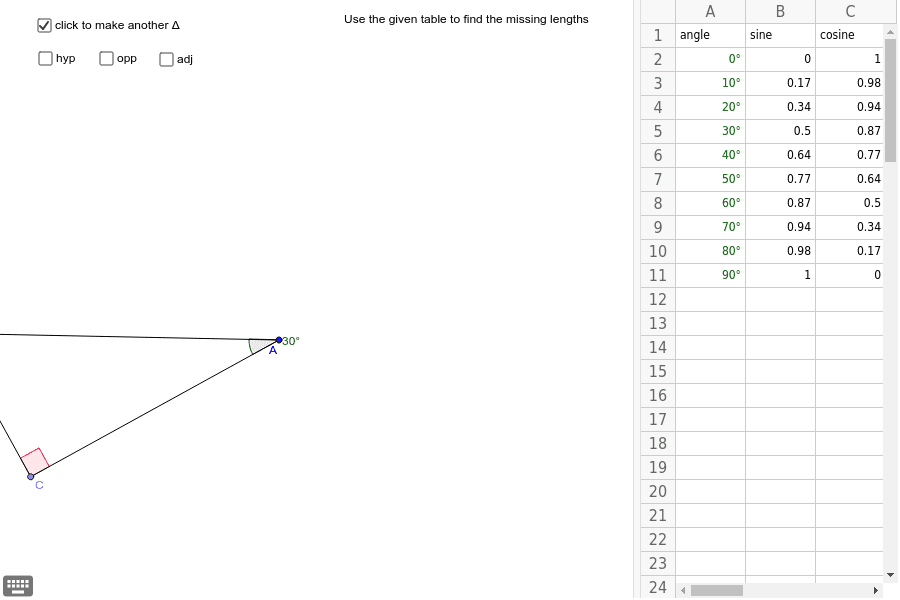
This example demonstrates the use of sine and cosine tables in GeoGebra, showing the application of trigonometric functions in geometric figures. Key mathematical concepts include trigonometry, geometric construction, and coordinate geometry. Construction involves using commands like Rotate, CircleArc, Point, etc. It is suitable for middle or high school mathematics education to understand the relationship between trigonometric functions and geometry.
GeoGebra Commands & Parameters
Rotate(D, 355*°, A) → D'CircleArc(A, D, D') → c_1Point(c_1) → CCircle(A, d) → fSegment(A, C) → bRotate(C, α, A) → C'Ray(A, C') → b_1Intersect(f, b_1, 1) → BSegment(B, C) → aSegment(B, A) → cAngle(A, C, B) → γAngle(C, A, B) → δMidpoint(c) → EMidpoint(b) → FMidpoint(a) → G
AI Drawing Prompt Reference
Draw a right triangle to illustrate the geometric relationship between sine and cosine functions. Start by drawing a circle and marking a point on it. Connect this point to the center of the circle and draw the path traced by the point when rotated around the center. Then, take another point on the traced path and connect it to the center, forming a new triangle. Finally, label the sides and angles of the triangle, as well as the midpoints of each side, to demonstrate the application of sine and cosine functions in geometry.
The prompt above was compiled from the original drawing commands and is for reference only.