
Sine and Cosine Graphs by Malin Christersson
Loading the math board and drawing, please wait…
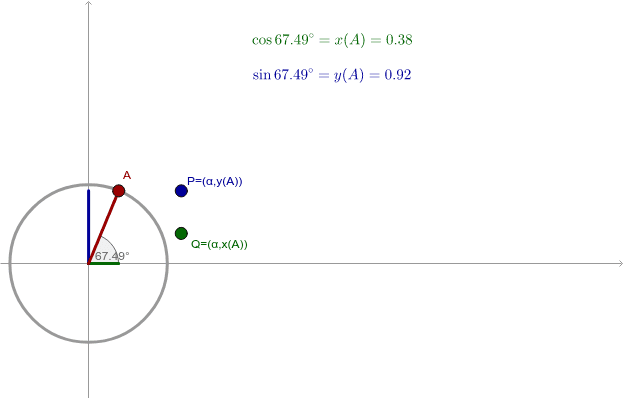
This example demonstrates how to draw sine and cosine graphs by dragging the red point. It involves core math concepts like trigonometric functions, unit circle, and coordinate geometry. GeoGebra commands used include Intersect, Point, Circle, Angle, and Segment to construct the graphs and illustrate their relationship with the unit circle, suitable for high school students learning about trigonometric functions.
GeoGebra Commands & Parameters
Intersect(xAxis, yAxis) → OPoint(xAxis) → BCircle(O, B) → cPoint(c) → AAngle(B, O, A) → αSegment(O, P1) → aSegment(O, Q1) → bIntersect(a, b) → CSegment(C, A) → d
AI Drawing Prompt Reference
Draw a unit circle centered at the origin with adjustable radius. Place a point on the horizontal axis, and from it construct a perpendicular or tangent line to form an angle. Mark a point on the circle, connect it to the center, and drop a perpendicular segment to the horizontal axis. As the circle point is dragged, dynamically show the sine and cosine graphs on a coordinate plane, with the horizontal axis representing angle and the vertical axis representing function values. Include the circle, radius segment, projection segment, angle marker, and the two curves.
The prompt above was compiled from the original drawing commands and is for reference only.