
Simulation of Operational Cost Optimization Using Linear Programming
Loading the math board and drawing, please wait…
In collections
PROGRAM LINEAR
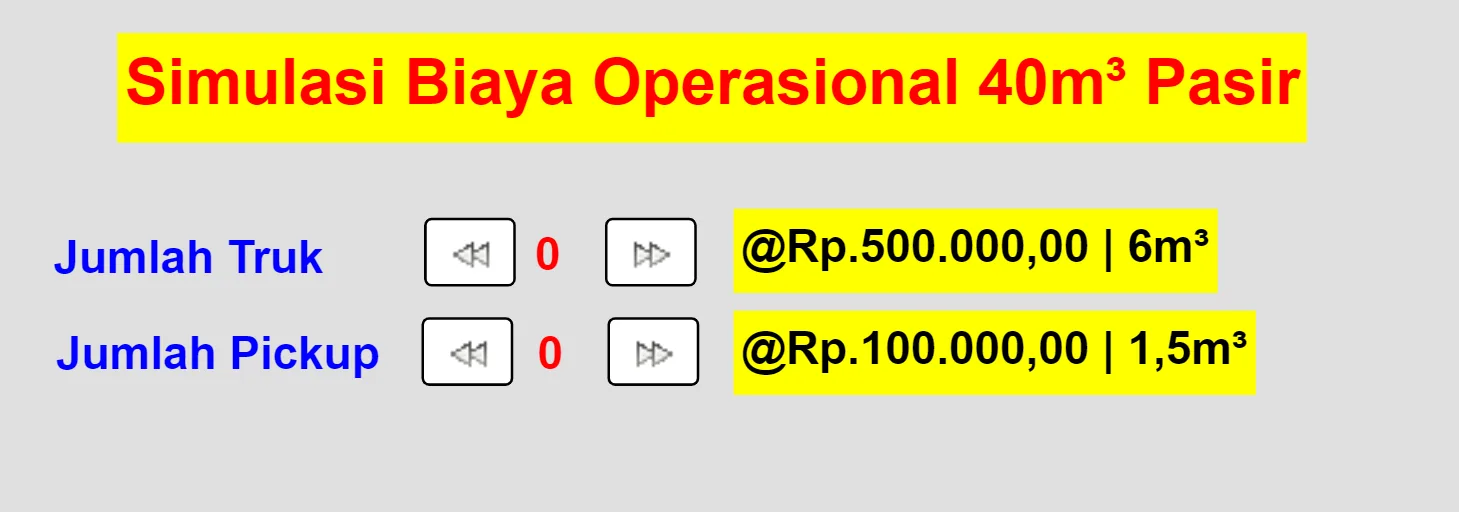
This GeoGebra example simulates the estimation of operational costs for goods transportation by applying linear programming. Users can adjust parameters a and b via sliders, and the construction visualizes the feasible region (including an incircle) and computes the minimum cost using derivatives. The core mathematics involve linear constraints, objective function minimization, geometric interpretation, and derivative calculations. The construction uses sliders, buttons, text objects, and points to trigger calculations and display remaining and total costs. It is suitable for high‑school and university students studying optimization, mathematical modeling, and operations research.
GeoGebra Commands & Parameters
Numeric a(0)Numeric b(0)Numeric p_3(220)Numeric p_1(0)Numeric p_2(82)40 - (6 * a) - (1.5 * b)a + b ≤ 13(500000 * a) + (100000 * b)
AI Drawing Prompt Reference
Draw a graphic that simulates the optimization of operational costs using linear programming. The graphic should include adjustable parameter areas with sliders for controlling parameters a and b. It should display a feasible region including a circle and calculate the minimum cost. Include text objects to show remaining and total costs. Ensure the graphic is clear and easy to understand for students studying optimization and mathematical modeling.
The prompt above was compiled from the original drawing commands and is for reference only.