
Interactive Demonstration of Piecewise Functions and Conic Sections
Loading the math board and drawing, please wait…
In collections
PROGRAM LINEAR
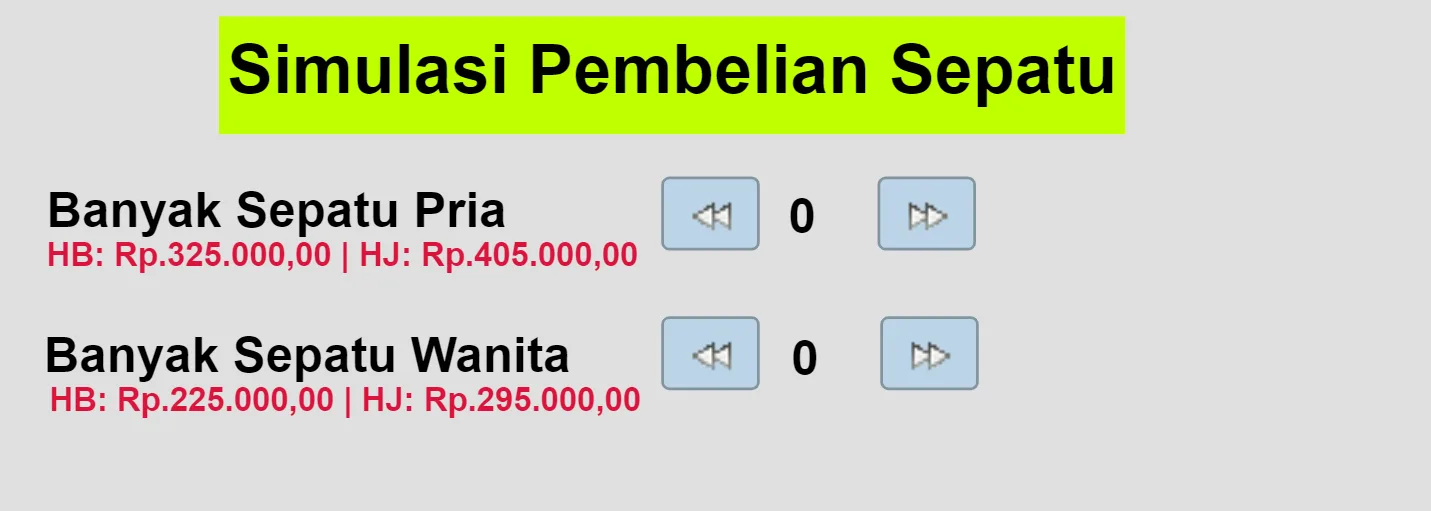
This GeoGebra example demonstrates the function graphs of piecewise functions and conic sections, controlled through interactive elements like buttons and sliders. The core mathematical concepts involved include piecewise-defined functions, conic sections (such as ellipses, hyperbolas, and parabolas), function graphing, and fraction operations. Key construction points: from the construction summary, it uses multiple text objects (text1 to text12) for labels and explanations, point objects (like p and w) to define key positions, slider objects (like s and u) to adjust parameters, and buttons (button1 to button4) to trigger different actions, such as switching graphs or performing calculations. Suitable for high school mathematics, particularly in functions and analytic geometry, it can be used for classroom teaching, demonstrations, or student self-study to intuitively understand mathematical concepts.
GeoGebra Commands & Parameters
Numeric p(0)Numeric w(0)15000000 - (p * 325000) - (w * 225000)(80000 * p) + (70000 * w)
AI Drawing Prompt Reference
On a coordinate plane, create two adjustable numeric control points representing parameters p and w. Then form two expression quantities that update with these parameters: the first is a constant minus a weighted sum, written as 15000000 − (p·325000) − (w·225000); the second is a weighted sum, written as (80000·p) + (70000·w). Display or compare these two computed results as the key objects, and ensure both quantities change interactively as p and w vary, to illustrate interactive parameter control relevant to function graphs and analytic geometry.
The prompt above was compiled from the original drawing commands and is for reference only.