
Linear Inequality Solution Region Demo
Loading the math board and drawing, please wait…
In collections
PROGRAM LINEAR
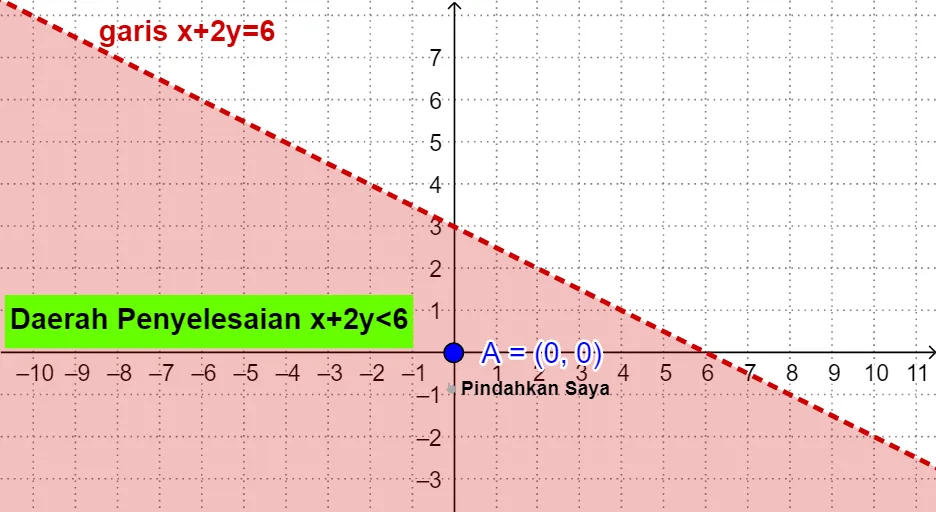
① This example shows how to graph a system of linear inequalities in the Cartesian plane and display the feasible region as a polygon. ② Core mathematical concepts include systems of linear inequalities, feasible sets, basic ideas of linear programming, and half‑plane representation in analytic geometry. ③ Construction highlights: GeoGebra’s Inequality command creates half‑planes, the Polygon command builds the feasible polygon from intersection points, and Point, Segment, Text objects (eq1, a, b, A, c, d, e, text1‑text7) label vertices and add explanatory notes. ④ Suitable for high‑school linear programming lessons, introductory operations research courses, and self‑study visualization practice.
GeoGebra Commands & Parameters
x + (2 * y) = 6a(x, y) = x + (2 * y) < 6b(x, y) = x + (2 * y) > 6Point A(0, 0)x(A)y(A)x(A) + (2 * y(A))
AI Drawing Prompt Reference
Draw the line x+2y=6 on a Cartesian plane, shade the half‑plane where x+2y<6 and the opposite half‑plane where x+2y>6, mark the origin with its coordinates, and display the value of the expression x+2y at that point, adding explanatory notes about the two half‑planes and the feasible region, using distinct colors for each half‑plane, label the boundary line, and include a brief textual description of how the intersection of the half‑planes would form a feasible polygon if additional constraints were present.
The prompt above was compiled from the original drawing commands and is for reference only.