
Geometric Construction for a Linear Programming Minimization Problem
Loading the math board and drawing, please wait…
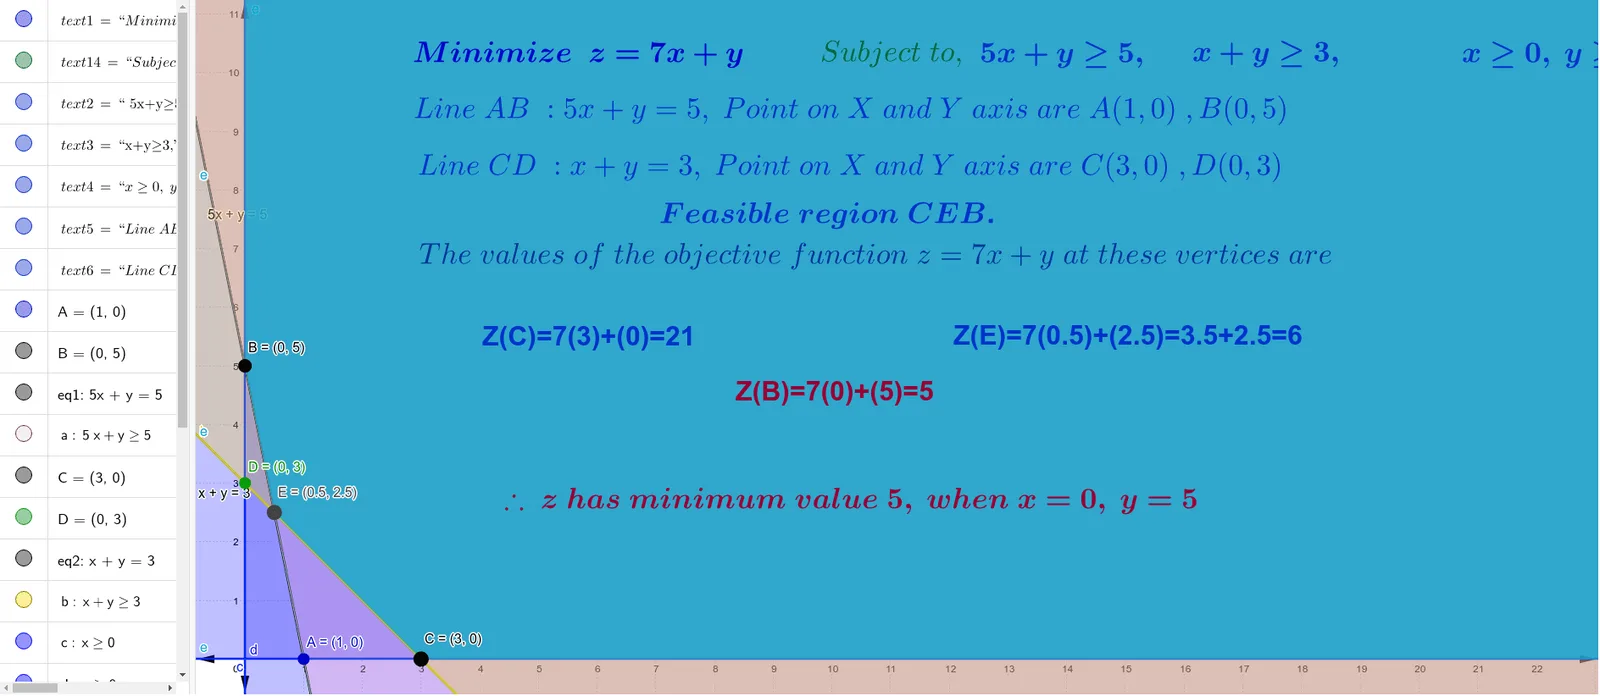
This GeoGebra example demonstrates how to solve a linear programming minimization problem by constructing the feasible region on the coordinate plane. It visualizes how linear inequality constraints form a polygon and how the objective function is minimized over that region, using the geometry of boundary intersections. Key mathematical concepts include linear programming/linear optimization, linear inequalities, feasible polytope (polygon) determination, and the relationship between objective-function lines and the extreme points of the feasible set; it also reflects step-like or piecewise reasoning through the way constraints and fractions/coefficients are represented. Construction-wise, it uses GeoGebra commands such as Point and Intersect to create key intersection points (e.g., A, B, C, D, E) that serve as polygon vertices, and then employs the prepared equation objects (eq1, eq2) together with labeled parameters (a, b, c, d, e) and text objects to organize the constraint boundaries and the optimization target for clear visualization. Suitable for high school to early university instruction in optimization, analytical geometry, or introductory linear algebra, and for classroom demonstrations or student exploration.
GeoGebra Commands & Parameters
Point(xAxis) → APoint(yAxis) → BPoint(xAxis) → CPoint(yAxis) → DIntersect(eq2, eq1) → E
AI Drawing Prompt Reference
Create a coordinate-plane diagram for a linear programming minimization setup. Place key reference points on the axes: one point on the x-axis and one on the y-axis, and also another pair with a point on the x-axis and a point on the y-axis to indicate where constraint boundaries are positioned. Then define two boundary line equations related to the constraints and mark their intersection as a crucial point, intended to serve as a vertex reference for the feasible polygon. Arrange the construction in the order: first choose the axis points, then compute and display the intersection.
The prompt above was compiled from the original drawing commands and is for reference only.