
Linear Programming - Graphical Method Demo
Loading the math board and drawing, please wait…
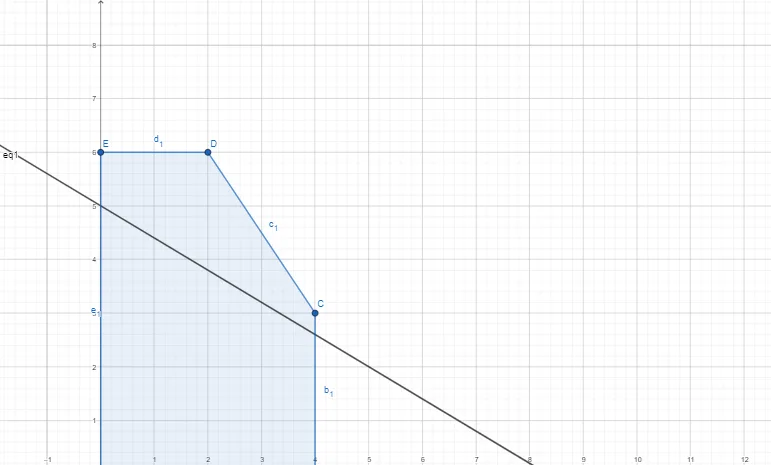
① This GeoGebra example demonstrates the graphical method for solving linear programming problems, showing how the feasible region and objective function interact to find the optimal solution. ② Core mathematical concepts include linear programming, constraint inequalities, feasible region, objective function level curves, and optimality (maximization or minimization). ③ Construction details: The example uses GeoGebra commands such as Intersect to find intersection points of constraint lines, Point to mark vertices, and Polygon to construct the feasible region polygon; objects include constraint lines a,b,c,d,e, their intersection points A,B,C,D,E, the feasible polygon poly1, and the objective function level line Z with equation eq1, allowing dynamic movement of the level line to observe the optimal solution. ④ Suitable for high school or early college students learning linear programming, and useful for teachers as a classroom demonstration tool to visualize the geometric approach to linear optimization.
GeoGebra Commands & Parameters
Intersect(xAxis, yAxis) → APoint(xAxis) → BPolygon(A, B, C, D, E) → poly1, a_1, b_1, c_1, d_1, e_1