
Simulation (2015 #2)
Loading the math board and drawing, please wait…
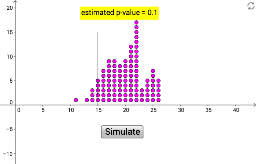
This example demonstrates how to use GeoGebra to create statistical charts, particularly box plots. It involves arithmetic and geometric means. Using commands like Sequence, CountIf, DotPlot, and Segment, users can visually understand data distribution. Suitable for high school math education and learning.
GeoGebra Commands & Parameters
Sequence(Random[1, 5], a, 1, 100) → list1CountIf(x ≟ 1, list1) → aDotPlot(data) → list2Segment((15, 0), (15, 15)) → f