
Simulating One Categorical Variable with Random Sampling
Loading the math board and drawing, please wait…
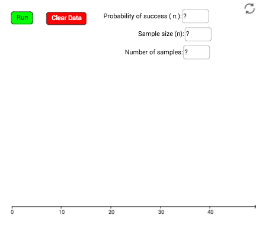
This GeoGebra example demonstrates how to simulate random sampling for a single categorical variable, dynamically showing the frequency of each category in the sample. The core mathematical concepts include categorical variables, binomial distribution, random sampling, frequency counting, and proportion estimation. Construction highlights: it uses the RandomBinomial command to generate random data following a binomial distribution, CountIf to count cases meeting a condition, and Textfield/inputBox for user-defined parameters such as sample size n and success probability a. Buttons trigger re-simulation, and results are displayed as lists and numeric values. Suitable for high school or introductory college statistics, this tool helps learners intuitively grasp randomness, sampling variability, and frequency fluctuations, and can serve as a springboard for discussing the law of large numbers and the central limit theorem.
GeoGebra Commands & Parameters
CountIf(x > -100, data) → bTextfield(pos) → inputBox1Textfield(n) → inputBox2Textfield(num) → inputBox3RandomBinomial(n, pos) → a
AI Drawing Prompt Reference
Create a statistical teaching graphic simulating random sampling for a single categorical variable. Place three input boxes in the center for setting sample size, success probability, and random seed. Include a button that triggers re-sampling. The main visual is a dynamically updated frequency list showing counts for each category, along with a numeric display of the proportion for one category. The layout is clean, emphasizing randomness and frequency fluctuation, suitable for explaining binomial distribution and sampling variability.
The prompt above was compiled from the original drawing commands and is for reference only.