
Simulating a Rod Broken into 3 Random Pieces
Loading the math board and drawing, please wait…
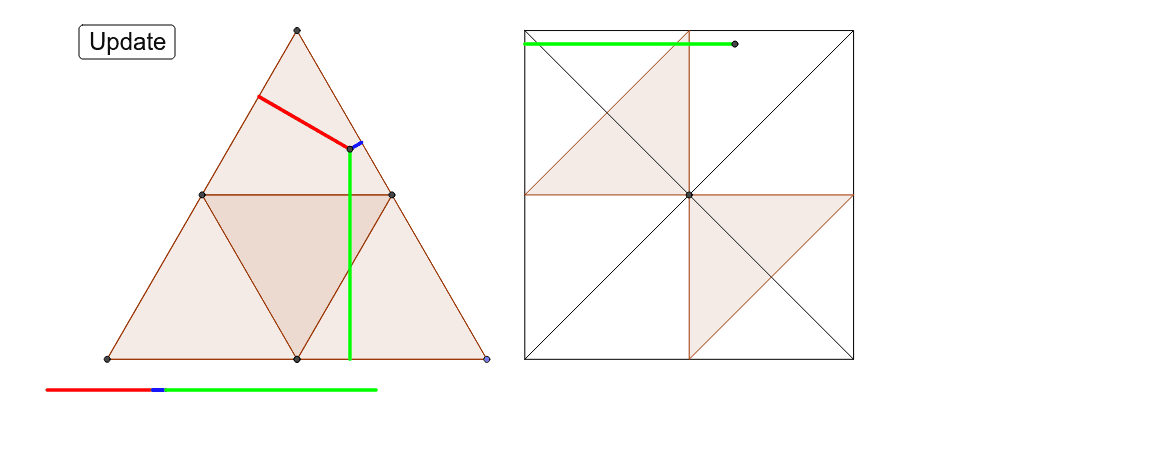
This example demonstrates the probability distribution when a rod is broken into three random pieces with break points uniformly distributed over its length. It involves core concepts in Probability & Statistics, particularly uniform distribution and geometric probability. The construction utilizes GeoGebra commands such as Intersect, Point, Polygon, Midpoint, Segment, Min, Max, Line, UnitVector, Translate, OrthogonalLine, Sort, and Circle. It is suitable for high school and above students learning probability theory and geometric constructions.
GeoGebra Commands & Parameters
Intersect(xAxis, yAxis) → APoint(xAxis) → BPolygon(A, B, 3) → poly1, a, b, c, CMidpoint(c) → DMidpoint(b) → EMidpoint(a) → FPolygon(E, D, 3) → poly2, d, e, f, GSegment(C, F) → gMin(h, i) → len1Max(h, i) → kLine(C, A) → lSegment(D, B) → mUnitVector(m) → uTranslate(l, Vector[(u * len2)]) → l'Intersect(j, l') → HOrthogonalLine(H, b) → nOrthogonalLine(H, a) → pOrthogonalLine(H, c) → qIntersect(q, c) → IIntersect(n, b) → JIntersect(p, a) → KSegment(I, H) → rSegment(H, K) → sSegment(H, J) → tSegment(L, M) → a_1Segment(M, N) → b_1Segment(N, O) → c_1Segment(S, R) → d_1Segment(R, Q) → e_1Segment(Q, P) → f_1Segment(P, S) → g_1Segment(P, R) → h_1Segment(S, Q) → i_1Midpoint(e_1) → TMidpoint(f_1) → UMidpoint(g_1) → VMidpoint(d_1) → WIntersect(i_1, h_1) → A_1Polygon(V, W, U, T) → poly3, v, w, u_1, t_1Segment(Z, C_1) → j_1Segment(Z, B_1) → k_1Sort({a_1, b_1, c_1}) → list1Circle(D_1, b_1) → p_1Circle(E_1, c_1) → q_1Intersect(p_1, q_1, 1) → F_1Polygon(D_1, F_1, E_1) → poly4, e_2, d_2, f_2
AI Drawing Prompt Reference
Draw a rod broken into three random pieces to illustrate probability distribution. Start by sketching a triangle representing the rod, then find and connect the midpoints of each side to form an inner triangle. Next, draw a line from one end of the rod and create two parallel lines at the other end based on the lengths of the inner triangle's sides, dividing the rod into three random segments. Finally, draw three circles at the vertices of the inner triangle and connect them to the outer triangle's vertices to visualize the geometric probability distribution.
The prompt above was compiled from the original drawing commands and is for reference only.