
Simple Bar Graph
Loading the math board and drawing, please wait…
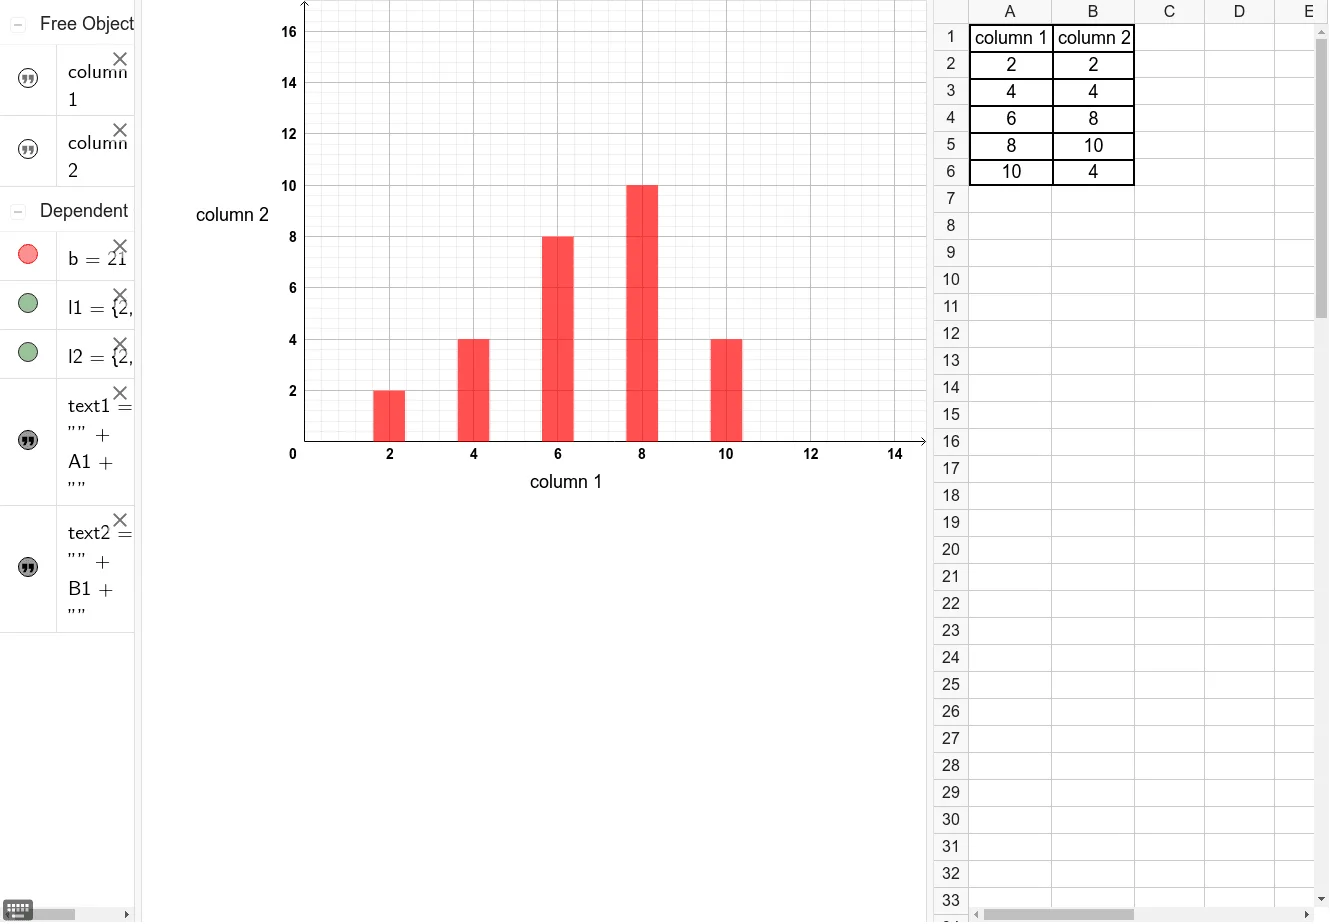
This example demonstrates how to create a simple bar graph using GeoGebra, involving core math concepts like statistics, binomial distribution, Poisson distribution, derivatives, and coordinate translation. Key GeoGebra commands and objects used include BarChart, B2-B6, A2-A6, B1, l1, l2, b, text2, A1, text1 for data representation and graphical construction. Suitable for high school mathematics teaching and introductory statistics learning.
GeoGebra Commands & Parameters
BarChart(l1, l2, 0.75) → b