
Sharing Juice Glasses
Loading the math board and drawing, please wait…
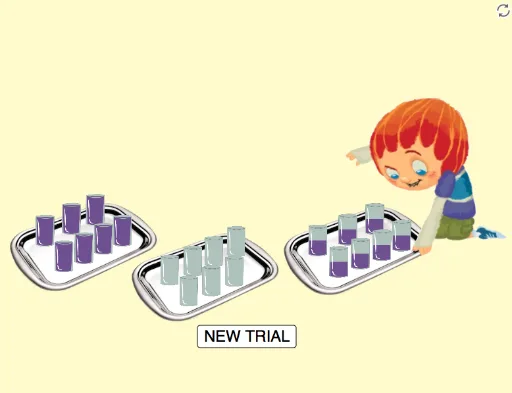
This example demonstrates dynamic juice distribution among multiple glasses using GeoGebra, showcasing geometric transformations and quantitative relationships. Core math concepts include division, unit circle, quadratic functions, 3D vectors, polynomial functions, and symmetry. Construction highlights the use of commands like Polygon, CountIf, and If, creating objects (A_3 to D_2) and locus lines (L series). Suitable for high school mathematics teaching to visualize functions, vectors, and geometric transformations.
GeoGebra Commands & Parameters
Polygon(A_3, B_3, C_3, D_3) → q3, a_2, b_2, c_9, d_2Polygon(A_2, B_2, C_2, D_2) → q2, a_1, b_1, c_8, d_1CountIf(IsInRegion[T, q2], T, {L_{v1}, L_{v2}, L_{v3}, L_{v4}, L_{v5}, L_{v6}, L_{v7}}) → vazios_{t2}CountIf(IsInRegion[T, q3], T, {L_{v1}, L_{v2}, L_{v3}, L_{v4}, L_{v5}, L_{v6}, L_{v7}}) → vazios_{t3}CountIf(IsInRegion[T, q3], T, {L_{c1}, L_{c2}, L_{c3}, L_{c4}, L_{c5}, L_{c6}, L_{c7}}) → cheios_{t3}CountIf(IsInRegion[T, q2], T, {L_{c1}, L_{c2}, L_{c3}, L_{c4}, L_{c5}, L_{c6}, L_{c7}}) → cheios_{t2}CountIf(IsInRegion[T, q3], T, {L_{m1}, L_{m2}, L_{m3}, L_{m4}, L_{m5}, L_{m6}, L_{m7}}) → meios_{t3}CountIf(IsInRegion[T, q2], T, {L_{m1}, L_{m2}, L_{m3}, L_{m4}, L_{m5}, L_{m6}, L_{m7}}) → meios_{t2}Polygon(A_1, B_1, C_1, D_1) → q1, a, b, c, dCountIf(IsInRegion[T, q1], T, {L_{c1}, L_{c2}, L_{c3}, L_{c4}, L_{c5}, L_{c6}, L_{c7}}) → cheios_{t1}CountIf(IsInRegion[T, q1], T, {L_{m1}, L_{m2}, L_{m3}, L_{m4}, L_{m5}, L_{m6}, L_{m7}}) → meios_{t1}CountIf(IsInRegion[T, q1], T, {L_{v1}, L_{v2}, L_{v3}, L_{v4}, L_{v5}, L_{v6}, L_{v7}}) → vazios_{t1}If(cheios_{t1} ≟ 3 ∧ meios_{t1} ≟ 1 ∧ vazios_{t1} ≟ 3 ∧ cheios_{t2} ≟ 3 ∧ meios_{t2} ≟ 1 ∧ vazios_{t2} ≟ 3 ∧ cheios_{t3} ≟ 1 ∧ meios_{t3} ≟ 5 ∧ vazios_{t3} ≟ 1, 1, 0) → s_1If(IsInRegion[L_{c1}, q1], s_1 ≟ 1) → eIf(cheios_{t1} ≟ 1 ∧ meios_{t1} ≟ 5 ∧ vazios_{t1} ≟ 1 ∧ cheios_{t2} ≟ 3 ∧ meios_{t2} ≟ 1 ∧ vazios_{t2} ≟ 3 ∧ cheios_{t3} ≟ 3 ∧ meios_{t3} ≟ 1 ∧ vazios_{t3} ≟ 3, 1, 0) → s_2If(cheios_{t1} ≟ 3 ∧ meios_{t1} ≟ 1 ∧ vazios_{t1} ≟ 3 ∧ cheios_{t2} ≟ 1 ∧ meios_{t2} ≟ 5 ∧ vazios_{t2} ≟ 1 ∧ cheios_{t3} ≟ 3 ∧ meios_{t3} ≟ 1 ∧ vazios_{t3} ≟ 3, 1, 0) → s_3If(cheios_{t1} ≟ 3 ∧ meios_{t1} ≟ 1 ∧ vazios_{t1} ≟ 3 ∧ cheios_{t2} ≟ 2 ∧ meios_{t2} ≟ 3 ∧ vazios_{t2} ≟ 2 ∧ cheios_{t3} ≟ 2 ∧ meios_{t3} ≟ 3 ∧ vazios_{t3} ≟ 2, 1, 0) → s_4If(cheios_{t1} ≟ 2 ∧ meios_{t1} ≟ 3 ∧ vazios_{t1} ≟ 2 ∧ cheios_{t2} ≟ 3 ∧ meios_{t2} ≟ 1 ∧ vazios_{t2} ≟ 3 ∧ cheios_{t3} ≟ 2 ∧ meios_{t3} ≟ 3 ∧ vazios_{t3} ≟ 2, 1, 0) → s_5If(cheios_{t1} ≟ 2 ∧ meios_{t1} ≟ 3 ∧ vazios_{t1} ≟ 2 ∧ cheios_{t2} ≟ 2 ∧ meios_{t2} ≟ 3 ∧ vazios_{t2} ≟ 2 ∧ cheios_{t3} ≟ 3 ∧ meios_{t3} ≟ 1 ∧ vazios_{t3} ≟ 3, 1, 0) → s_6
AI Drawing Prompt Reference
Create a dynamic juice distribution visualization using geometric shapes. Draw multiple glasses with different levels of juice (red for full, blue for half-full, green for empty) across three tiers. Use polygons to represent the glasses and lines to indicate the flow of juice. The construction should highlight geometric transformations and symmetry, demonstrating functions, vectors, and their relationships in a visually engaging way suitable for high school mathematics teaching.
The prompt above was compiled from the original drawing commands and is for reference only.