
Sets and Venn Diagrams (2 Sets)
Loading the math board and drawing, please wait…
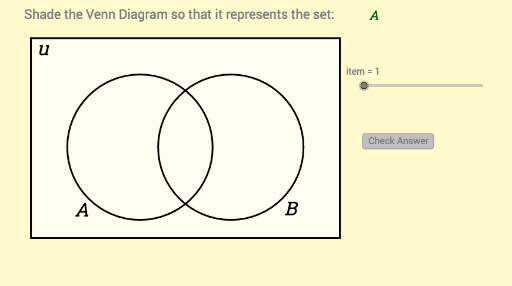
This example demonstrates how to use Venn diagrams to represent the intersection and union of two sets. Core math concepts include set operations, intersection, union, and set representation. Construction highlights involve GeoGebra commands/objects like Segment, If, Element, Length, Polygon, and Corner. Suitable for high school mathematics learning to understand the basics of set theory and visualizing set relationships.
GeoGebra Commands & Parameters
Segment((x_1, y_1), (x_1, y_2)) → eSegment((x_1, y_2), (x_2, y_2)) → fSegment((x_2, y_1), (x_2, y_2)) → gSegment((x_2, y_1), (x_1, y_1)) → hIf(IsGreen1, 0, 1) → RB1If(IsGreen1, 0.4, 1) → G1If(IsGreen2, 0, 1) → RB2If(IsGreen3, 0, 1) → RB3If(IsGreen4, 0, 1) → RB4If(IsGreen2, 0.4, 1) → G2If(IsGreen3, 0.4, 1) → G3If(IsGreen4, 0.4, 1) → G4Element(problem, item, 1) → textitemLength(problem) → iElement(problem, item, 2) → keyPolygon(Corner[1], Corner[2], Corner[3], Corner[4]) → poly1, l, m, n, qCorner(5) → G