
Separating Ships: A Related Rates Problem
Loading the math board and drawing, please wait…
In collections
Fun with Functions
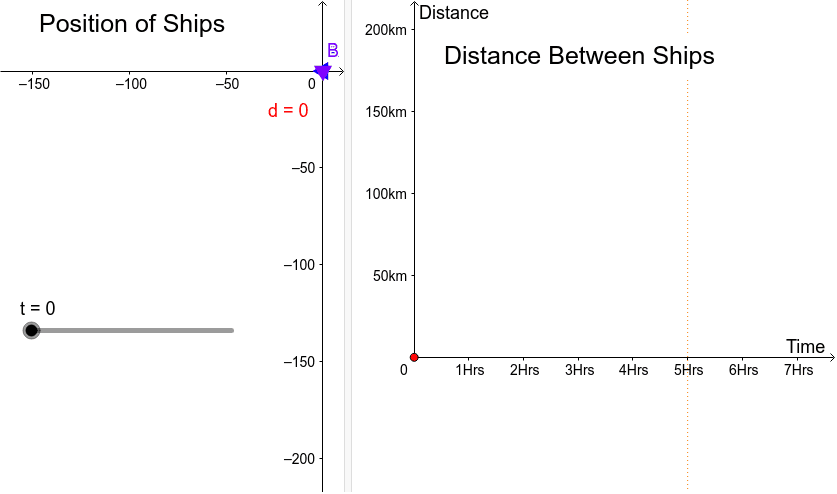
① This example illustrates how the distance between two ships moving in opposite directions changes over time. ② Key mathematical concepts involve calculus related rates, derivatives, linear equations, and vector representation of motion. ③ The construction uses GeoGebra commands Segment and OrthogonalLine, with objects t, A, B, d, D, C, a, text1, text2 to model the scenario and display dynamic changes. ④ Suitable for high school and early university calculus students, as well as for modeling and visualization exercises in mathematics.
GeoGebra Commands & Parameters
Segment(A, B) → dOrthogonalLine(C, xAxis) → a
AI Drawing Prompt Reference
Draw a graph showing the distance between two ships moving in opposite directions over time. The graph should include the positions of the ships, the distance line between them, and how the distance changes dynamically. The construction order is to first draw the ship positions, then the distance line, and finally show the changing distance.
The prompt above was compiled from the original drawing commands and is for reference only.