
Section 2.2 Practice: Graphing Linear Equations with Slope and Y-Intercept
Loading the math board and drawing, please wait…
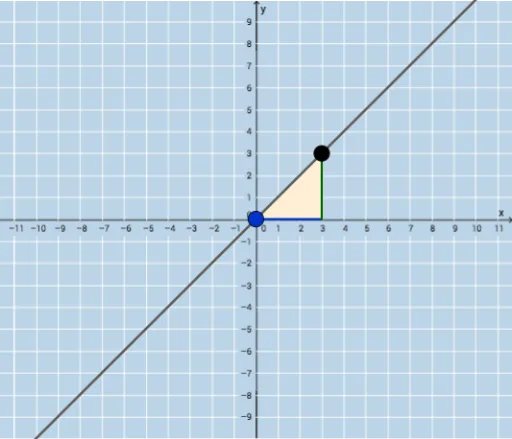
This interactive GeoGebra applet demonstrates how to graph linear equations using the slope and y-intercept. Students can manipulate sliders or click buttons to change parameters and instantly see how the line shifts on the coordinate plane, with immediate feedback. Core mathematical concepts include linear equations, slope, y-intercept, coordinate geometry, and intersections with axes. The construction uses commands such as Sequence to generate point lists, Union to combine sets, Random for random parameters, Point to define key points, Line to draw the line, FractionText to display slope as a fraction, Intersect to find intersection points, Polygon to form triangles, Segment for line segments, and multiple buttons and text boxes for interactive control. This applet is suitable for middle or high school students learning linear functions, and can be used for classroom demonstrations or self-paced practice to build intuition about how slope and intercept affect the graph.
GeoGebra Commands & Parameters
Sequence(i, i, -10, -1) → aSequence(i, i, -10, -1) → bSequence(i, i, 1, 10) → cUnion(b, c) → dRandom(-12, 12) → ePoint(x = 0) → ALine(A, B) → gFractionText(Slope[f]) → text1FractionText(f(0)) → text2Intersect(j, i) → CPolygon(A, C, B) → poly1, b_1, a_1, c_1Segment(A, C) → kSegment(C, B) → l