
Adjustable Area Model
Loading the math board and drawing, please wait…
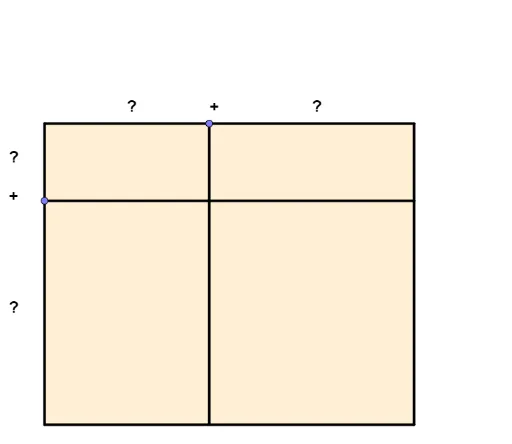
This example demonstrates the dynamic adjustment of polygon sides and vertices to illustrate area changes, involving core math concepts like polygon area calculation, multiplication principles, binomial distribution, correlation, natural numbers, bar charts, and polynomial functions. It utilizes GeoGebra commands like Polygon, Sequence, Point, and Text as per the construction summary, making it suitable for high school mathematics teaching to visually integrate functions, statistics, and geometry.
GeoGebra Commands & Parameters
Polygon((0, 0), (factor1, 0), (factor1, factor2), (0, factor2)) → q1, f, g, h, iSequence(Point[{i, factor2}], i, 0, factor1) → L_1Sequence(Point[{0, i}], i, 0, factor2) → L_2Point(L_1) → APoint(L_2) → BPolygon((0, 0), B, (x(A), y(B)), (x(A), 0)) → q2, j, b_1, k, lPolygon(B, (0, factor2), A, (x(A), y(B))) → q3, b_2, m, a_1, nPolygon((x(A), y(B)), A, (factor1, factor2), (factor1, y(B))) → q4, p, a_2, q, rPolygon((x(A), y(B)), (factor1, y(B)), (factor1, 0), (x(A), 0)) → q5, s, t, e, f_1Text(factor1 - x(A), Midpoint[a_2] + (0, height)) → factor1part2Text("+", A + (0, height)) → topPlusText("+", B - (left, 0)) → leftPlusText(y(B), Midpoint[j] - (left, 0)) → factor2part2Text(factor2 - y(B), Midpoint[b_2] - (left, 0)) → factor2part1Text(((factor2 - y(B)) * x(A)), Centroid[q3]) → area3Text((y(B) * x(A)), Centroid[q2]) → area2Text(((factor2 - y(B)) * (factor1 - x(A))), Centroid[q4]) → area4Text((y(B) * (factor1 - x(A))), Centroid[q5]) → area5Text((factor1 * factor2)) → text2Text(x(A), Midpoint[m] + (0, height)) → factor1part1Text("?", Midpoint[m] + (0, height)) → f1p1qText("?", Midpoint[a_2] + (0, height)) → f1p2qText("?", Midpoint[b_2] - (left, 0)) → f2p1qText("?", Midpoint[j] - (left, 0)) → f2p2q