
Linear Formulas and Graphs: Dynamic Geometry Demo
Loading the math board and drawing, please wait…
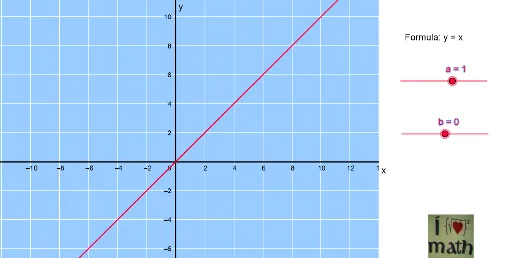
① This GeoGebra example dynamically demonstrates the correspondence between linear formulas and their graphs, allowing learners to intuitively understand how the slope and intercept of a linear function affect the position and direction of a line in the coordinate system. ② Core mathematical concepts include linear functions, function graphs, slope, intercept, and coordinate geometry of straight lines, with extensions to polygons, probability, quadratic equations, definite integrals, and matrices. ③ Construction highlights: from the summary, the Polygon command is used to create polygon objects (e.g., veelhoek1), with multiple points (A to H) and lines (e, f, g, h) defined, supplemented by text objects (tekst1, tekst2) and an image object (afbeelding1) for labeling and explanation, forming an interactive environment for exploring linear functions. ④ Suitable for middle and high school students learning function basics, as well as for teacher demonstrations or student self-exploration, bridging algebraic expressions and geometric visualizations.
GeoGebra Commands & Parameters
Polygon(E, F, G, H) → veelhoek1, e, f, g, h
AI Drawing Prompt Reference
Create a dynamic geometry illustration showing the correspondence between linear formulas and their graphs. Include a quadrilateral formed by four vertices, along with two straight lines representing different linear functions. Use adjustable sliders to change the slope and intercept of the lines, and observe how the quadrilateral and line positions shift. Add text labels and an explanatory image to clarify how slope and intercept affect the line's direction and placement. Arrange everything on a coordinate plane, suitable for middle school students to explore the link between algebra and geometry.
The prompt above was compiled from the original drawing commands and is for reference only.