
School Supplies Production Plan
Loading the math board and drawing, please wait…
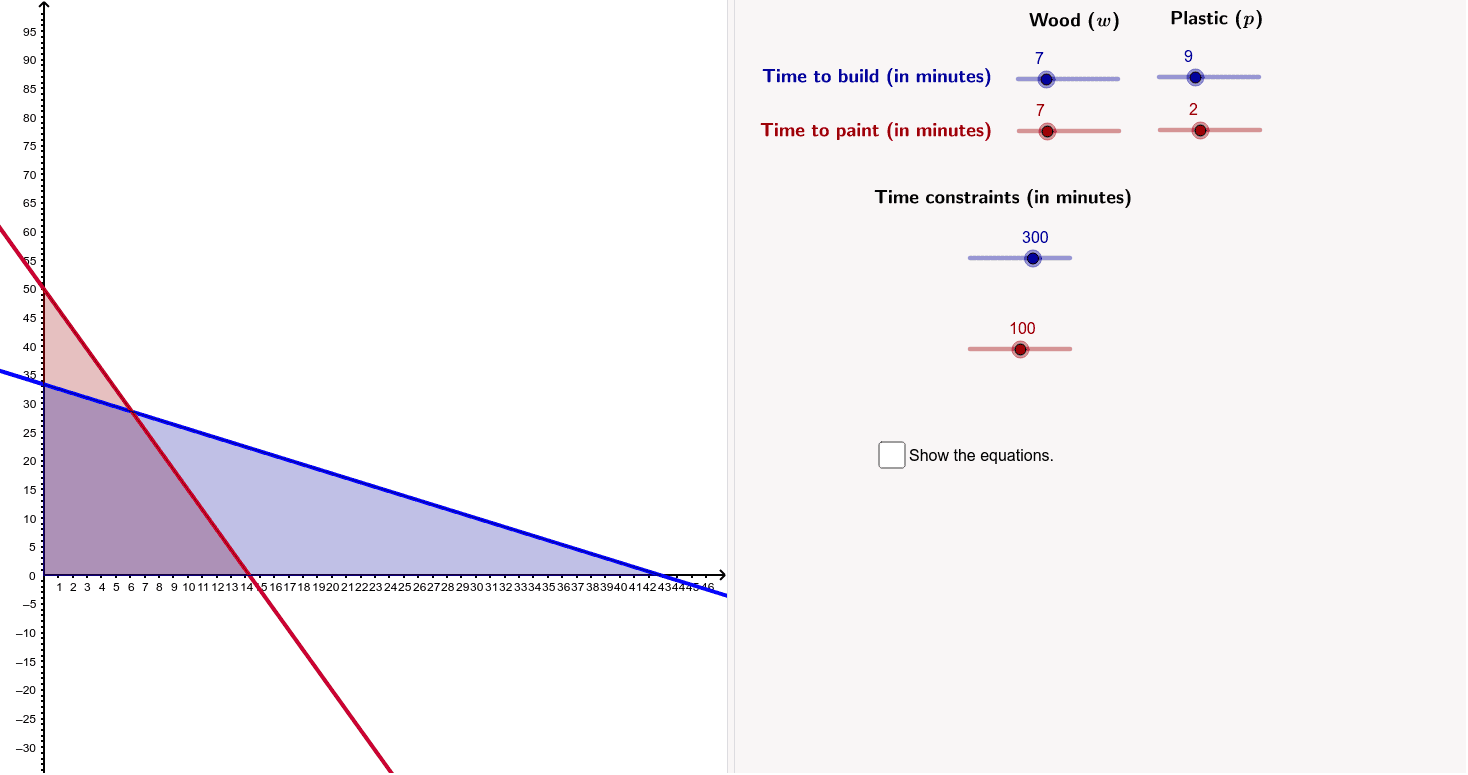
This example demonstrates a school supplies company's production plan for wooden and plastic rulers, involving production and painting. Key mathematical concepts include linear inequalities and functions. Using GeoGebra commands such as Intersect, Polygon, and TableText, a system of inequalities representing the production plan is constructed. Suitable for Grade 1 Algebra students to learn linear programming.
GeoGebra Commands & Parameters
Intersect(b, yAxis) → AIntersect(b, xAxis) → BIntersect(xAxis, yAxis) → CPolygon(A, B, C) → poly1, c, a_3, b_3Intersect(a, yAxis) → DIntersect(a, xAxis) → EPolygon(D, E, C) → poly2, c_3, d, eTableText({{((((a_1 * "\mathit{w} +") * b_1) * "\mathit{p} \leq") * c_1)}, {((((a_2 * "\mathit{w} +") * b_2) * "\mathit{p} \leq") * c_2)}, {"\mathit{w} \geq0"}, {"\mathit{p} \geq 0"}}, "{") → text7
AI Drawing Prompt Reference
Draw a production plan diagram for a school supplies company, including the production and painting of wooden and plastic rulers. Use linear inequalities to represent the production plan. First, draw two lines a and b, then find their intersections with the axes to get points A, B, D, and E. Use these points to draw two triangles representing the production constraints for each product. Finally, describe the inequalities in text: the first line is a_1*w+b_1*p<=c_1, the second line is a_2*w+b_2*p<=c_2, the third line is w>=0, and the fourth line is p>=0.
The prompt above was compiled from the original drawing commands and is for reference only.