
Scatter Plot and Best Fit Line by GeoGebra Team
Loading the math board and drawing, please wait…
In collections
Learn GeoGebra Classic
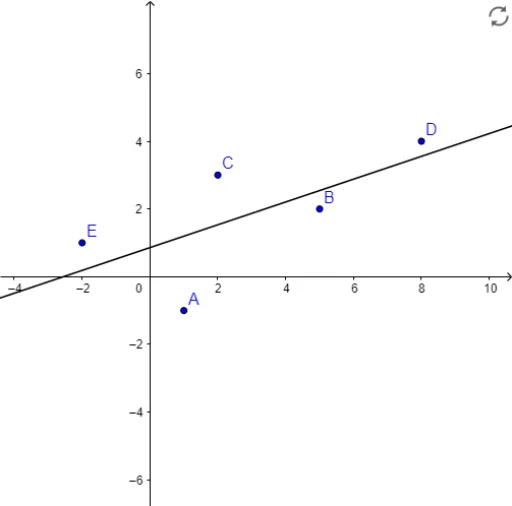
This example demonstrates how to create a Scatter Plot and explore the best fit line using GeoGebra. It visually shows scatter data and its linear trend. Key math concepts include data analysis, linear regression, and statistical graphs. Construction highlights involve using GeoGebra commands like FitLineY on objects A1-E, A-E, Liste1. Suitable for high school mathematics teaching or introductory data analysis learning.
GeoGebra Commands & Parameters
FitLineY({A, B, C, D, E}) → a
AI Drawing Prompt Reference
Create a scatter plot with five data points showing a roughly linear upward trend. Then add a best-fit line that passes as close as possible to all points, illustrating the overall trend. Include coordinate axes, point markers, and the line to highlight the relationship between data distribution and linear regression.
The prompt above was compiled from the original drawing commands and is for reference only.