
Scalar Product and Angle Between Vectors
Loading the math board and drawing, please wait…
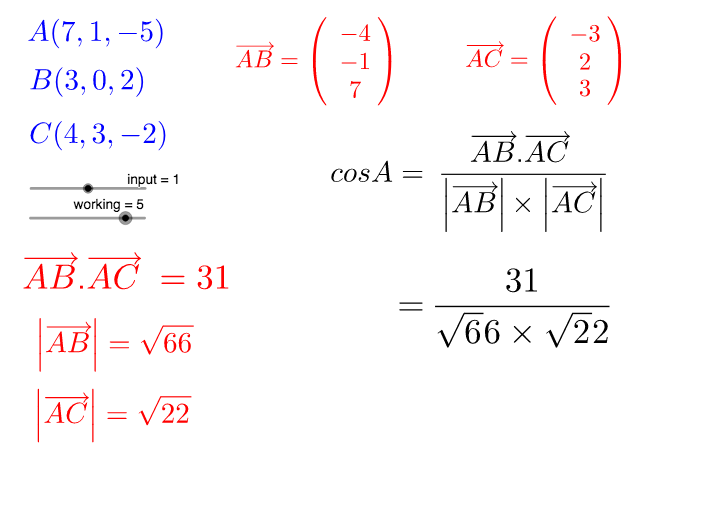
This GeoGebra applet demonstrates the geometric interpretation of the dot product (scalar product) between two vectors and its relationship with the included angle. Users can interactively adjust vector components through input boxes to observe how the dot product changes and verify the formula a·b=|a||b|cosθ. Key mathematical concepts include vector coordinates in 3D space, dot product calculation, angle between vectors, and the law of cosines. Construction details: Textfield command creates interactive input boxes (inputBoxA_x, inputBoxA_y, inputBoxA_z, inputBoxB_x, inputBoxB_y, inputBoxB_z) for vector endpoints A, B, C; coordinate objects (A_x, A_y, A_z, B_x, B_y, B_z, C_x, C_y, C_z) define vectors; vector objects w and a represent computed vectors; text objects dynamically display the angle and calculation results. Suitable for high school mathematics courses on vectors and introductory linear algebra lessons.
GeoGebra Commands & Parameters
Textfield(A_y) → inputBoxA_yTextfield(A_x) → inputBoxA_xTextfield(A_z) → inputBoxA_zTextfield(B_x) → inputBoxB_xTextfield(B_y) → inputBoxB_yTextfield(B_z) → inputBoxB_zTextfield(C_x) → inputBoxC_xTextfield(C_y) → inputBoxC_yTextfield(C_z) → inputBoxC_z
AI Drawing Prompt Reference
Create a 3D coordinate system with two vectors originating from the origin, each in a distinct color. The endpoint coordinates of each vector are controlled by six interactive input boxes, corresponding to the x, y, z components of the two vectors. Dynamically display the dot product value and the angle between the vectors, with the angle marked by an arc. The layout should be clear for observing how the dot product and angle change as vector directions vary.
The prompt above was compiled from the original drawing commands and is for reference only.