
Satisfied Customers Simulation (1-prop z)
Loading the math board and drawing, please wait…
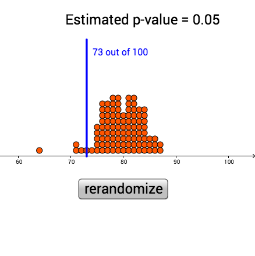
This example demonstrates simulating customer satisfaction data using statistical methods. Key mathematical concepts include probability and data analysis. Construction involves GeoGebra commands like Sequence, DotPlot, CountIf, and Segment. Suitable for high school or university statistics courses.
GeoGebra Commands & Parameters
Sequence(RandomBinomial[100, 0.8], n, 1, 100) → list1DotPlot(list1, false, 0.2) → list2CountIf(x > 0, list1) → aSegment((73, 0), (73, 4)) → f
AI Drawing Prompt Reference
Draw a bar chart showing the probability distribution of success counts in 100 random trials. The chart includes bars representing success counts, with heights indicating the number of successes and positions indicating trial numbers. Below the chart, add a counter showing the number of successes greater than zero. The construction order is to generate random data, then draw the bar chart, and finally add the counter.
The prompt above was compiled from the original drawing commands and is for reference only.