
Sampling from a Bivariate Data Population
Loading the math board and drawing, please wait…
In collections
Statistics Demonstrations
Statistics Demonstrations
Statistics Demonstrations
Statistics Demonstrations
Statistics Demonstrations
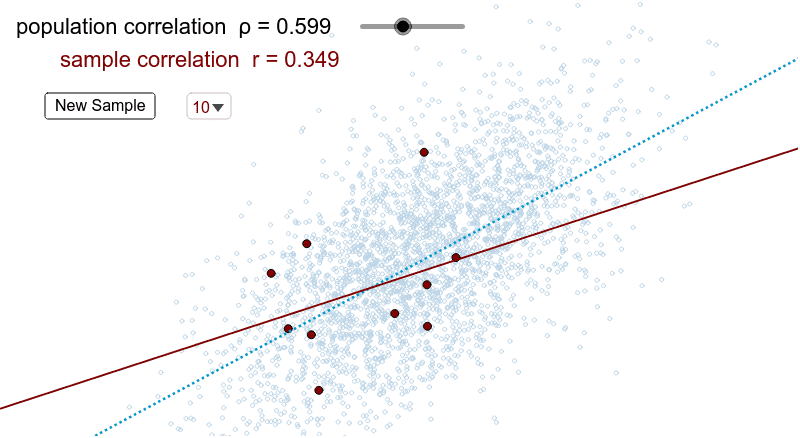
This example demonstrates sampling from a population of bivariate data. Key mathematical concepts include correlation, linear regression, and statistics. Using GeoGebra commands such as SelectedElement, Sequence, and FitLineY, a dynamic sampling process is constructed. Suitable for high school and above students or teachers for teaching and research.
GeoGebra Commands & Parameters
SelectedElement(size) → nSequence(RandomNormal[mx, sx], k, 1, popSize) → xValSequence((Element[xVal, k], (m * Element[xVal, k]) + b + RandomNormal[my, sy]), k, 1, popSize) → popFitLineY(pop) → cSequence(Element[pop, (0 * trigger) + Random[1, popSize]], k, 1, n) → samplePtsFitLineY(samplePts) → d
AI Drawing Prompt Reference
Create a sample from a bivariate data population by first generating a group of randomly normally distributed data points, then randomly selecting sample points from this group, and finally performing linear regression on the sample points to show both the sample points and the regression line.
The prompt above was compiled from the original drawing commands and is for reference only.