
Sampling Distribution of the Sample Mean
Loading the math board and drawing, please wait…
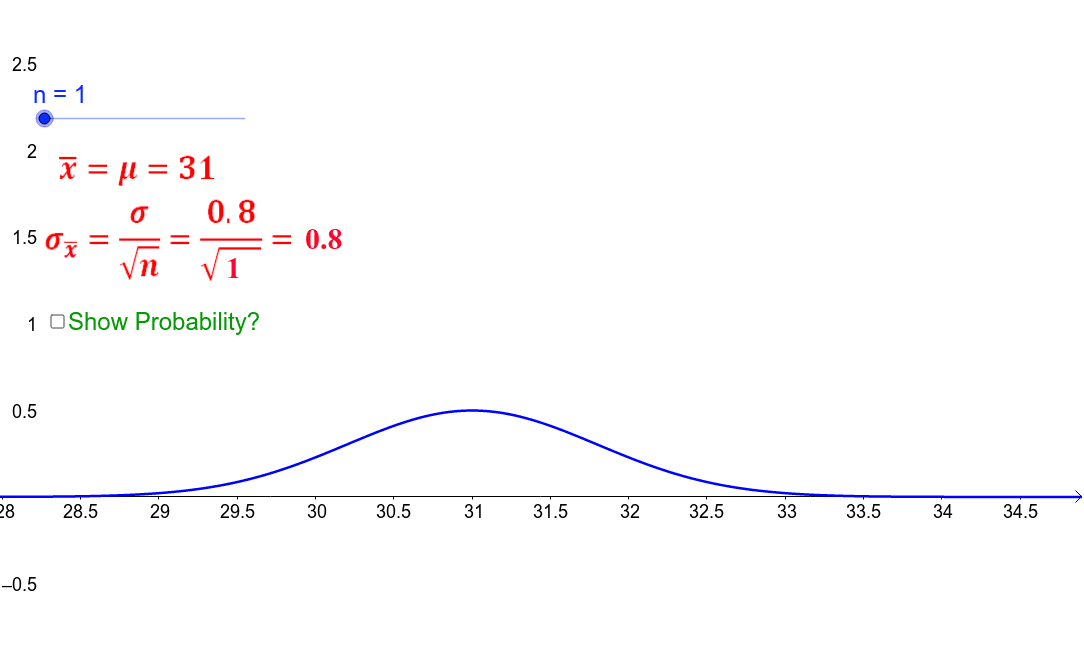
This example demonstrates how changing the sample size affects the mean of a sample from a normal distribution, including a set upper-tail probability. Key math concepts include normal distribution, mean, variance, and probability. It is constructed using GeoGebra commands like IntegralBetween and objects such as n, e, μ, σ, sig, f, pic1, text_n, text_s, pic2, pic4, int, text1, p. Suitable for high school students and researchers.
GeoGebra Commands & Parameters
IntegralBetween(f, 0, 31.56, 99) → int
AI Drawing Prompt Reference
Draw the sampling distribution of the sample mean from a normal distribution, observing how the mean changes with sample size. Plot a normal distribution curve, set an upper-tail probability, and display the distribution of sample means. First, plot the normal distribution curve, then set the sample size n, calculate the mean μ and standard deviation σ, next plot the distribution of means, and finally add a visualization of the upper-tail probability.
The prompt above was compiled from the original drawing commands and is for reference only.