
Sampling Distribution of the Mean Demo
Loading the math board and drawing, please wait…
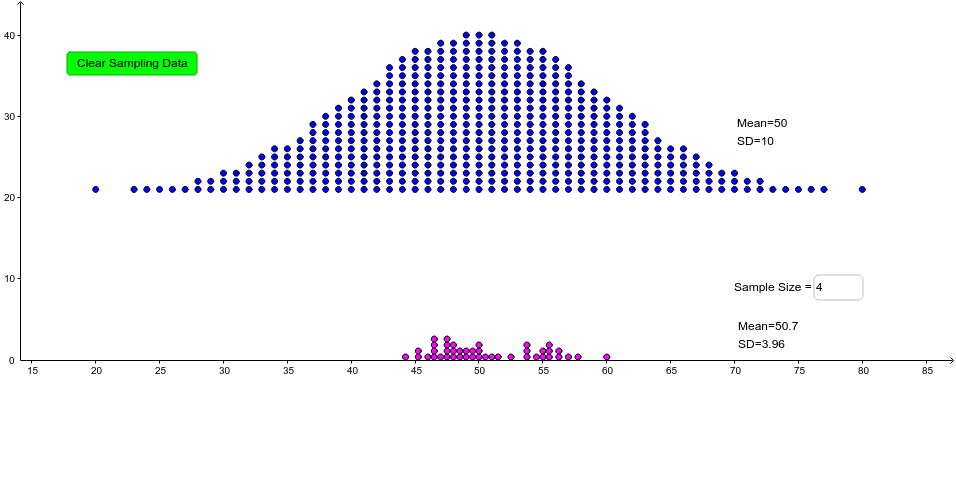
This example demonstrates repeatedly sampling (with replacement) from a population of 500 approximately normal data values and plotting the sampling distribution of the mean. Key math concepts include sampling distribution, sample mean, normal distribution, and frequency histogram. It uses GeoGebra commands like Sequence, Mean, Textfield, DotPlot, and Translate to visualize the process. Suitable for high school and above students learning statistics and probability & statistics.
GeoGebra Commands & Parameters
Sequence(RandomElement[datatags], a, 1, n) → list1Mean(list1) → aTextfield(n) → inputBox1DotPlot(data, true, 1) → list2Translate(DotPlot[datatags], (0, 20)) → list3
AI Drawing Prompt Reference
Create a frequency histogram of 500 approximately normally distributed data values and demonstrate the sampling distribution by repeatedly sampling with replacement to calculate the sample mean. First, generate a list of 500 random data values, calculate the mean of the list, then input the sample size, draw the frequency histogram of the data, and finally translate the histogram up by 20 units.
The prompt above was compiled from the original drawing commands and is for reference only.