
Visualizing Rational and Irrational Numbers on Number Line
Loading the math board and drawing, please wait…
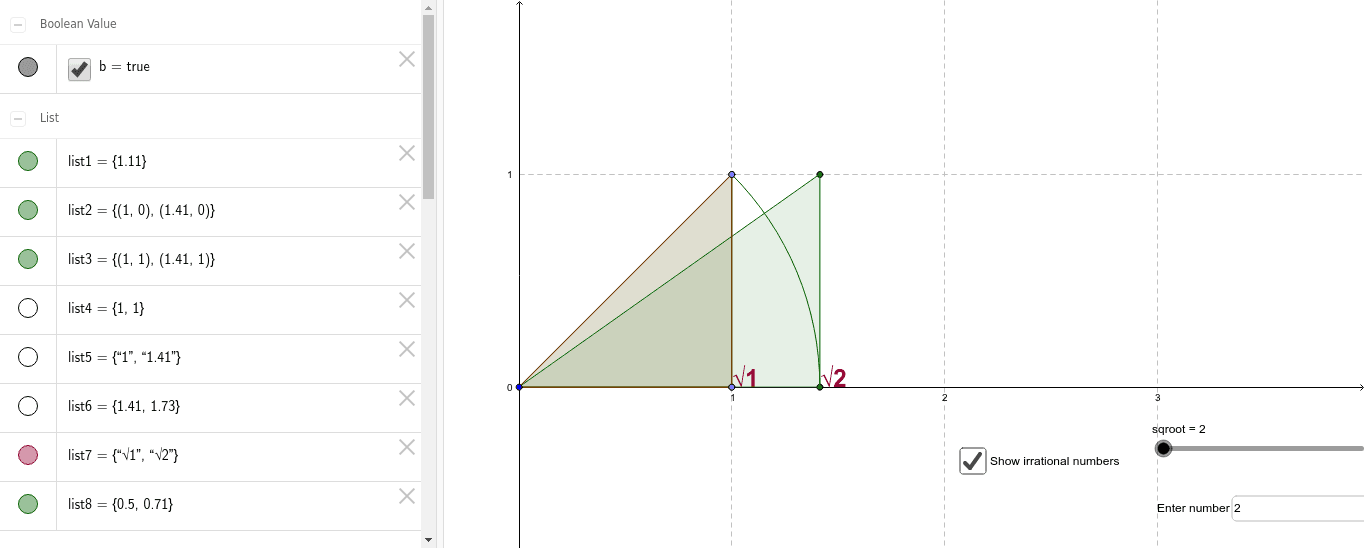
This example demonstrates the visualization of rational and irrational numbers on a number line. It involves key mathematical concepts such as real numbers and irrational numbers. Using GeoGebra commands like Sequence, Point, and Textfield, it dynamically shows the positions of irrational numbers on the number line. Suitable for students at the middle school level and above to learn about real number theory and the properties of irrational numbers.
GeoGebra Commands & Parameters
Sequence((sqrt(d), 0), d, 1, sqroot, 1) → list2Sequence((sqrt(d), 1), d, 1, sqroot, 1) → list3Sequence(Segment[Element[list2, i], Element[list3, i]], i, 1, sqroot) → list4Point(yAxis) → ASequence(Segment[A, Element[list3, i]], i, 1, sqroot) → list6Sequence(CircleArc[A, Element[list2, i], Element[list3, i - 1]], i, 2, sqroot) → list1Textfield(sqroot) → inputBox1Sequence(Text[sqrt(d), (sqrt(d), 0)], d, 1, sqroot, 1) → list5Sequence(Text[(text3 * d), (sqrt(d), 0)], d, 1, sqroot, 1) → list7Point(list3) → BPoint(xAxis) → DPolygon(B, C, D) → poly1, d, b_1, c_1Sequence(Polygon[C, Element[list2, i], Element[list3, i]], i, 1, sqroot) → list8
AI Drawing Prompt Reference
Visualize rational and irrational numbers on a number line, demonstrating real number theory. Draw a horizontal number axis and a vertical helper line, then mark irrational numbers with points and connect them to the axis with line segments. Use circular arcs to link adjacent points and label each irrational number below. Combine all elements into a cohesive whole to clearly show the distribution of rational and irrational numbers.
The prompt above was compiled from the original drawing commands and is for reference only.