
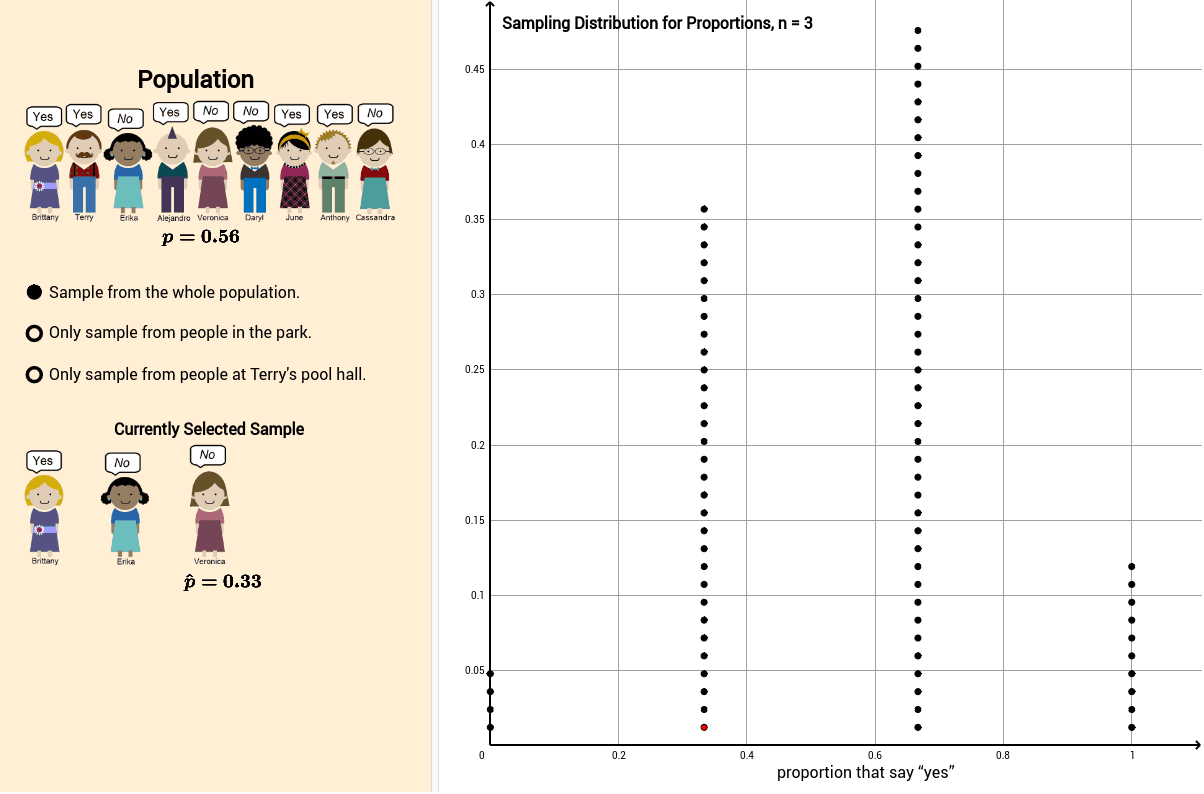
Sampling Distribution for Proportions, n = 3
Loading the math board and drawing, please wait…
This GeoGebra example demonstrates the sampling distribution of sample proportions when drawing samples of size 3 from a population. It enumerates all possible subsets (combinations) of size 3, computes the proportion of successes for each subset, and displays the resulting distribution as a dot plot. The key mathematical concepts include sampling distribution, sample proportion, combinatorial enumeration, discrete probability distribution, and the foundational idea of the central limit theorem. The construction uses GeoGebra commands such as Zip and Sequence to generate all subsets, Length and Element to calculate proportions, and DotPlot to visualize the distribution. Interactive elements like sampleDisplayed allow users to step through individual samples. This resource is ideal for high school or introductory college statistics courses, helping students grasp how sample proportions vary and how the sampling distribution relates to the population parameter.
GeoGebra Commands & Parameters
Zip(population(a), a, subsets) → subsetsAnswersSequence(Sum[Element[subsetsAnswers, i]] / 3, i, 1, Length[subsetsAnswers]) → samplingDistDotPlot(samplingDist) → dotplotLength(dotplot) → dotplotLengthElement(subsets, sampleDisplayed) → selectedSample
AI Drawing Prompt Reference
Create a dot plot illustrating the sampling distribution of sample proportions for samples of size 3 drawn from a population. The horizontal axis represents the possible sample proportion values (from 0 to 1), and the vertical axis shows the frequency or count of each proportion. Each dot corresponds to one sample's proportion. The plot should include all possible combinations of size 3, with a slider to step through individual samples, highlighting the selected sample's proportion. The distribution should show discrete variation and central tendency, reflecting how sample proportions vary around the population parameter.
The prompt above was compiled from the original drawing commands and is for reference only.