
Does TV Make You Smarter? — Modeling Causality and Confounding with GeoGebra
Loading the math board and drawing, please wait…
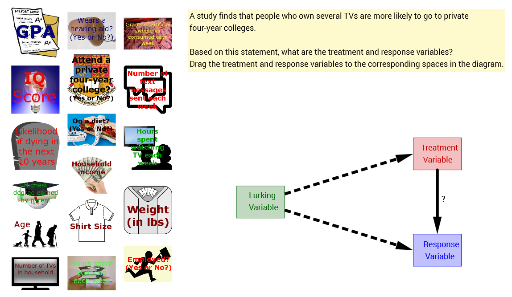
This GeoGebra example presents a fictional statistical study scenario to explore the causal question of whether watching TV makes people smarter. It demonstrates how to build a geometric and algebraic model using polygons, points, vectors, segments, and length measurements to represent treatment and response groups, while introducing a lurking variable (e.g., hearing aid) to illustrate the difference between correlation and causation. The core mathematical concepts involved include parabolas, sequences and series, Poisson distribution, algebra, and 3D shapes, but the construction focuses on using GeoGebra commands such as Polygon, Point, Vector, Segment, and Length to create visual comparisons, with dynamic variables (treatmentVariable, responseVariable, lurkingVariable) for parameter adjustment. This example is suitable for high school or introductory college statistics and probability courses, serving as an interactive tool for teachers to demonstrate experimental design, randomization, confounding control, and data visualization, and for students to grasp the fundamentals of causal inference.
GeoGebra Commands & Parameters
Polygon(F, treatment, H, I) → treatmentPoly, f, g, h, iPolygon(J, response, L, M) → responsePoly, j, k, l, mPoint(g) → NPoint(m) → OVector(N, O) → uVector((0, 7), B) → vVector((0, 5), C) → wPolygon(A, P, lurking, R) → poly1, a, p, q, rSegment(tvs, treatment) → treatmentSegSegment(fancyCollege, response) → responseSegSegment(income, lurking) → lurkingSegLength(lurkingSeg) → lurkingLenLength(treatmentSeg) → treatmentLenLength(responseSeg) → responseLen
AI Drawing Prompt Reference
Draw a statistical causal demonstration: create a quadrilateral on the left for the treatment group, another on the right for the response group, and connect them with an arrow vector showing influence. Below, add a third quadrilateral for a lurking variable, and draw segments from it to both the treatment and response groups, with length labels on each segment. Arrange all shapes clearly to compare relationships and highlight confounding.
The prompt above was compiled from the original drawing commands and is for reference only.