
Sample Sizes for Estimating Population Proportion
Loading the math board and drawing, please wait…
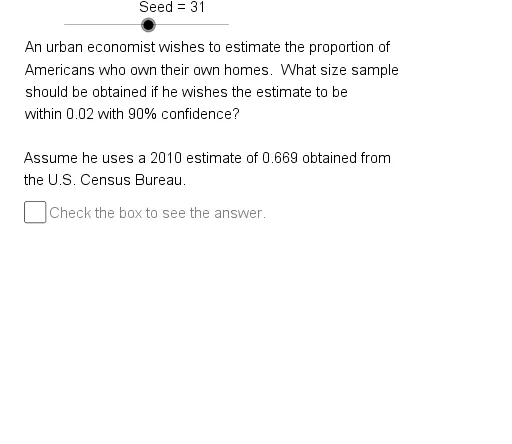
This example demonstrates how to estimate a population proportion using sample proportions. Key mathematical concepts include probability and statistics. Using GeoGebra commands such as Sequence, Element, and If, users can dynamically adjust sample proportions and observe their impact on the estimation. Suitable for high school and above students or teachers.
GeoGebra Commands & Parameters
Sequence(Mod[5 + (29 * k), 61] + 1, k, 1, 60) → OpSqElement(OpSq, Seed) → Op1Element(CnfSq, Mod[Op3, 4] + 1) → CnfElement(MltSq, Mod[Op1, 6] + 1) → MltElement(ErrSq, Mod[Op2, 5] + 1) → ErrElement(EstSq, Mod[Op2, 6] + 1) → EstIf(ErrPrc ≟ 1, " book", " books") → BkSPIf(ErrPrc ≟ 1, " point", " points") → PTSegment(EFLE, EFRE) → efdbCircumcircleArc(EFLT, EFLC, EFLB) → eflpCircumcircleArc(EFRT, EFRC, EFRB) → efrpSegment(ESRE, ESLE) → esdbCircumcircleArc(ESLT, ESLC, ESLB) → eslpCircumcircleArc(ESRT, ESRC, ESRB) → esrpMod(Op1, 2) → PEIf(PE ≟ 1, SzPE, SzNE) → SizeCircumcircleArc(NFLT, NFLC, NFLB) → nflpCircumcircleArc(NSLB, NSLC, NSLT) → nslpSegment(NFLE, NFRE) → nfdbSegment(NSLE, NSRE) → nsdbCircumcircleArc(NFRB, NFRC, NFRT) → nfrpCircumcircleArc(NSRB, NSRC, NSRT) → nsrpMod(Op2, 2) → PorPIf(PorP ≟ 0, "percentage", "proportion") → PorPTxIf(PorP ≟ 0, EstPrc, Est) → PorPNmIf(PorP ≟ 0, "%", "") → PrSgElement(DDSq, ChNm2) → DD0
AI Drawing Prompt Reference
This is a graphic to demonstrate estimating a population proportion. It includes multiple circular arcs, line segments, and points. The construction order is to first create a sequence, then extract elements from it, and finally draw arcs and segments using these elements. The graphic is used to illustrate probability and statistics concepts of sample proportion estimation, suitable for high school students or teachers.
The prompt above was compiled from the original drawing commands and is for reference only.