
Sample Size Problems for Proportions & Means
Loading the math board and drawing, please wait…
In collections
Sample Size
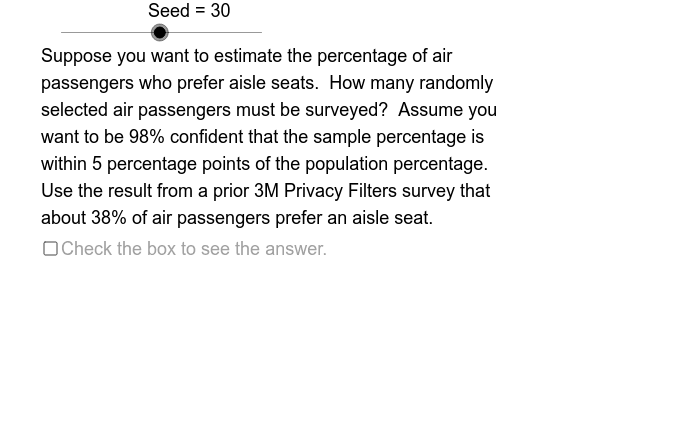
This example demonstrates how to solve sample size problems involving means or proportions using GeoGebra. It covers concepts like sample size calculation, confidence intervals, margin of error, and statistical inference. The construction utilizes GeoGebra commands such as Sequence, Element, If, Segment, and CircumcircleArc. Suitable for high school students and educators in probability & statistics and data analysis courses.
GeoGebra Commands & Parameters
Sequence(Mod[7 + 31 * k, 60] + 1, k, 1, 60) → OpSqElement(OpSq, Seed) → OptElement(EstSq, Mod[Opt, 6] + 1) → PrpEstElement(FcSqPrp, Mod[Opt, 5] + 1) → FctPrpElement(CfSq, Mod[Opt, 4] + 1) → ConfIf(Mod[Opt, 2] ≟ 0, 0, 1) → OEElement(SgSq, Choice) → StDvElement(MltSqMn, Mod[Opt, 3] + 1) → MltMnElement(FcSqMn, Mod[Opt, 5] + 1) → FctMnIf(OE ≟ 0, ErrPrp, ErrMn) → ErrElement(MltSqPrp, Mod[Opt, 6] + 1) → MltPrpIf(ErrMn ≟ 1, " book", " books") → PlBkIf(ErrMn ≟ 1, " point", " points") → PlPtSegment(AEL, AER) → ADvBrCircumcircleArc(ALT, ALC, ALB) → ALfPrCircumcircleArc(ART, ARC, ARB) → ARtPrSegment(DER, DEL) → DDvBrCircumcircleArc(BLT, BLC, BLB) → BLfPrCircumcircleArc(BRT, BRC, BRB) → BRtPrElement(PSSq, Mod[Opt, 6] + 1) → PS0CircumcircleArc(CLT, CLC, CLB) → CLfPrIf(OE ≟ 0, ALfPr, CLfPr) → LfPr1CircumcircleArc(CRT, CRC, CRB) → CRtPrIf(OE ≟ 0, ARtPr, CRtPr) → RtPr1If(OE ≟ 0, PrpEqSt, MnEqSt) → DspEqStSegment(CEL, CER) → CDvBrIf(OE ≟ 0, ADvBr, CDvBr) → DvBr1CircumcircleArc(DLT, DLC, DLB) → DLfPrIf(OE ≟ 0, BLfPr, DLfPr) → LfPr2If(OE ≟ 0, SzPrp, SzMn) → SizeSegment(BER, BEL) → BDvBrCircumcircleArc(DRT, DRC, DRB) → DRtPrIf(OE ≟ 0, BRtPr, DRtPr) → RtPr2If(OE ≟ 0, PrpSb, MnSb) → DspSbIf(OE ≟ 0, PrpNm1, MnNm1) → DspNm1If(OE ≟ 0, PrpDn1, MnDn1) → DspDn1If(OE ≟ 0, PrpEqMd, MnEqMd) → DspEqMdIf(OE ≟ 0, PrpEx1, MnEx1) → DspEx1If(OE ≟ 0, PrpFrc, MnFrc) → DspFrcIf(OE ≟ 0, PrpEx2, MnEx2) → DspEx2If(OE ≟ 0, PrpRslt, MnRslt) → DspRsltIf(OE ≟ 0, BDvBr, DDvBr) → DvBr2
AI Drawing Prompt Reference
Create a statistical chart demonstrating sample size problems for proportions and means, featuring multiple circular arcs, segments, and labels to represent confidence intervals, margin of error, and sample sizes, start with basic geometric shapes, then add calculation results and statistical symbols, finally differentiate proportion and mean parts with different colors.
The prompt above was compiled from the original drawing commands and is for reference only.