
Sample Means Demo
Loading the math board and drawing, please wait…
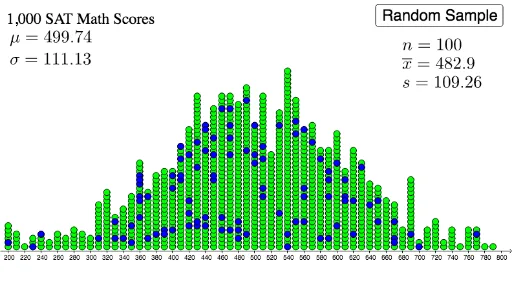
This example demonstrates the distribution and statistical characteristics of sample means. It involves core math concepts like sample mean, sample standard deviation, and statistical distribution. Constructed using GeoGebra commands such as DotPlot for histogram, Mean for average calculation, Sample for generating samples, MeanX and SampleSDX for sample mean and standard deviation, and SDX for standard deviation. Suitable for high school and above students to understand statistical properties of samples.
GeoGebra Commands & Parameters
DotPlot(L_1) → list2Mean(L_1) → aSample(list2, n + b, false) → list3MeanX(list3) → cSampleSDX(list3) → dSDX(L_1) → e
AI Drawing Prompt Reference
Create a statistical visualization showing the distribution of sample means, including a histogram for the sample data distribution and two curves representing the distribution of sample means and sample standard deviations, with specific values for the sample mean and standard deviation labeled, start with the histogram, then draw the curves for means and standard deviations, and finally label the values.
The prompt above was compiled from the original drawing commands and is for reference only.