
Intersection of a Parabola and a Line by Brian Sterr
Loading the math board and drawing, please wait…
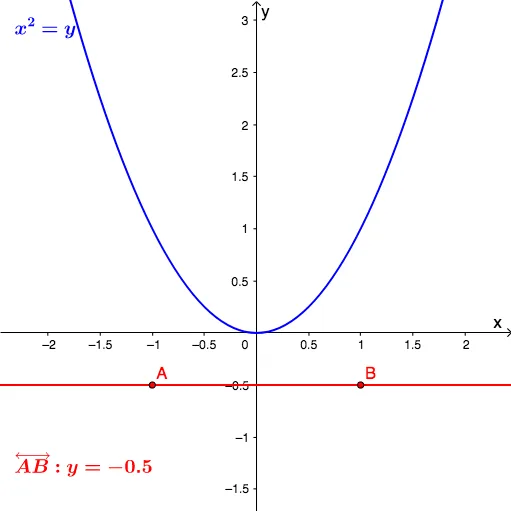
This example demonstrates how to find the intersection points between a parabola and a line in a coordinate plane, allowing dynamic observation of how the number and positions of intersections change as parameters vary. The core mathematical concepts involve solving a system of a quadratic and a linear equation, the discriminant's role in determining the number of real solutions, and coordinate geometry for locating intersection points. Construction highlights: using GeoGebra's Line command to create the line, Intersect command to compute intersection points, and sliders or text objects (such as m, c, h, k, p, text1, text2) to control parameters, generating points A, B, C, D. Suitable for middle and high school students learning the relationship between quadratic functions and lines, equation solving, and visual reasoning in algebra and geometry.
GeoGebra Commands & Parameters
Line(A, B) → fIntersect(c, f) → C, D
AI Drawing Prompt Reference
Draw the intersection points of a parabola and a line on a coordinate plane. The parabola and line can be controlled by parameters. Adjusting parameters changes the number and position of intersection points. The graph includes the parabola, the line, and the intersection points.
The prompt above was compiled from the original drawing commands and is for reference only.