
Intersection of Two Parabolas: Solving and Visualization
Loading the math board and drawing, please wait…
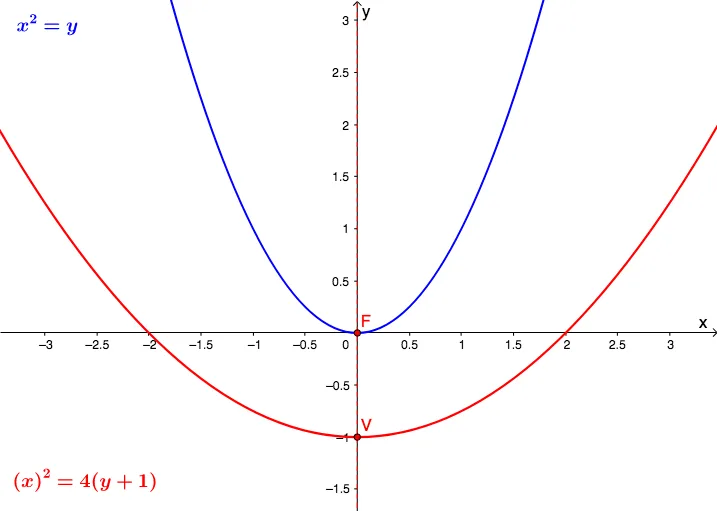
This GeoGebra example demonstrates how to find and visualize the intersection points of two parabolas. Using the Parabola command to define two parabolas with different parameters, and the Intersect command to automatically calculate and label their intersection coordinates. The core mathematical concepts involved include parabola equations, coordinate geometry methods for finding intersections, and the correspondence between algebra and geometry. Construction key points: Use Point command to create auxiliary points and intersection markers, Parabola command to define parabolas via focus and directrix, Intersect command to solve intersection coordinates, and text tools to display intersection data. Suitable for middle school to high school mathematics learners, ideal for teaching quadratic function graphs, visualizing system of equations solutions, and introducing coordinate geometry concepts.
GeoGebra Commands & Parameters
Point(f) → FParabola(F, y = y(V) - p) → dIntersect(c, d) → A, B, C, D
AI Drawing Prompt Reference
Draw two parabolas in the same coordinate plane and visualize where they intersect. Define the first parabola using a specified focus and a corresponding directrix parameter to determine its opening and position, then define the second parabola with the same style of definition but different parameter values. Next, find the intersection points of the two parabolas and mark them clearly. Add visible text labels showing the intersection coordinates, and distinguish the two parabolas by color or line style so the solution correspondence between equations and geometry is easy to read.
The prompt above was compiled from the original drawing commands and is for reference only.