
Rotation of Sinus Math'art
Loading the math board and drawing, please wait…
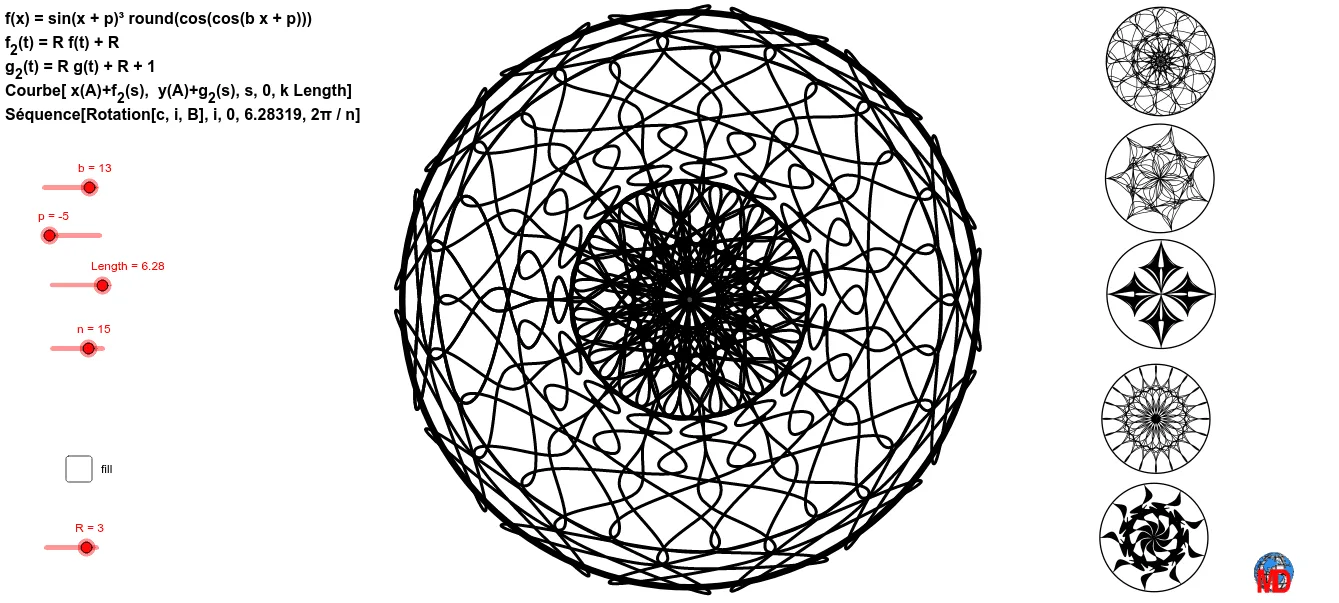
This example demonstrates the artistic effect of rotating a sinusoidal function graph in a plane. It involves core mathematical concepts such as function graphs, rotation transformations, complex numbers, and trigonometry. Key GeoGebra commands used include CurveCartesian for plotting sinusoidal curves, Sequence for generating sequences, If for conditional logic, and Circle for drawing circles, along with objects like Length, R, k, A, p, etc. It is suitable for high school students learning about function transformations, complex numbers, and the intersection of mathematics and art.
GeoGebra Commands & Parameters
CurveCartesian(x(A) + f_2(s), y(A) + g_2(s), s, 0, (k * Length)) → cSequence(Rotate[c, i, B], i, 0, 6.28319, (2 * π / n)) → liste1If(d, 1, 0) → opaCircle(B, (2.09 * R)) → q_1
AI Drawing Prompt Reference
Draw a sinusoidal function graph and rotate it around a point multiple times to show an artistic effect. Start by plotting the basic sine curve, then rotate it at equal angular intervals around the center point to create a series of concentric circular patterns, and finally adjust the transparency based on a condition to highlight the intersection of mathematics and art.
The prompt above was compiled from the original drawing commands and is for reference only.