
Roll Until...: Simulating Random Processes and Statistical Distributions
Loading the math board and drawing, please wait…
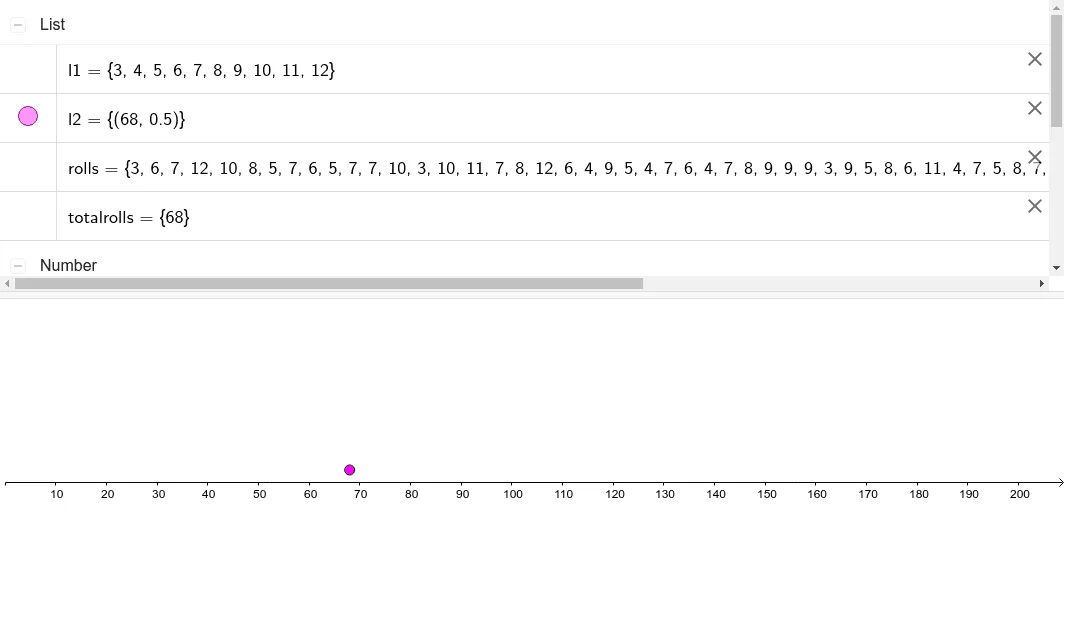
① This example repeatedly rolls dice and records the number of rolls needed until a target outcome appears, vividly demonstrating the simulation of random processes and statistical distributions. ② Core mathematical concepts include random variables, stochastic processes, combinatorics, probability distributions, and interpretation of statistical charts (box plots, dot plots), with sine functions and angles used for animation or coordinate transformations, and dilation for adjusting graphical display. ③ Construction highlights: GeoGebra commands Random, Unique, Length, BoxPlot, DotPlot are used; objects include d1, d2 (die outcomes), total (sum), n (target number), rolls (each roll record), l1 (data list), button1/button2 (control buttons), numrolls (current count), totalrolls (total count), a (angle parameter), l2 (auxiliary list). ④ Suitable for high school or university probability and statistics courses, to understand random experiments, the law of large numbers, empirical vs. theoretical distributions, and as an introductory case for computational mathematical exploration.
GeoGebra Commands & Parameters
Random(1, 6) → d1Random(1, 6) → d2Unique(rolls) → l1Length(rolls) → numrollsBoxPlot(-2, 1, totalrolls, true) → aDotPlot(totalrolls, false, 0.5) → l2
AI Drawing Prompt Reference
Simulate rolling dice until a target number appears, recording each roll's outcome and the number of attempts, then display the distribution of total attempts with box and dot plots, and animate to illustrate random variables and probability distributions.
The prompt above was compiled from the original drawing commands and is for reference only.