
Role of coefficients a, b, c, d in cubic function y=ax^3+bx^2+cx+d
Loading the math board and drawing, please wait…
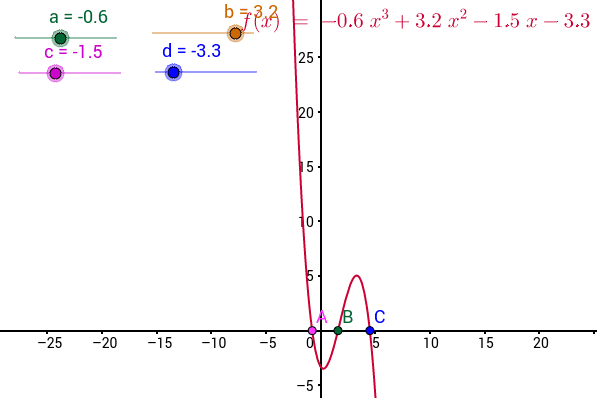
This GeoGebra example demonstrates the dynamic geometric impact of coefficients a, b, c, d on the cubic function y=ax^3+bx^2+cx+d, showing how setting a=0 transforms the graph into a parabola, and a=b=0 into a straight line. The core mathematical concepts include cubic functions, polynomial degeneration, and coefficient-driven geometric transformations. Constructed using the GeoGebra Intersect command with objects a, b, c, d, f, A, B, C, it allows users to manipulate parameters via sliders to visualize key intersection points and graph morphing. It is ideally suited for high school algebra, pre-calculus, and introductory calculus courses to teach the visual relationship between algebraic formulas and their coordinate graphs.
GeoGebra Commands & Parameters
Intersect(f, xAxis) → A, B, C
AI Drawing Prompt Reference
First draw a coordinate plane with the cubic curve y = ax^3 + bx^2 + cx + d, and add draggable sliders for coefficients a, b, c, and d. Then show the intersections of the curve with the x-axis, letting them move as the sliders change. Adjust the sliders to observe how the graph degenerates into a parabola when a = 0 and into a straight line when a = b = 0.
The prompt above was compiled from the original drawing commands and is for reference only.