
Riemann Sums Demonstration
Loading the math board and drawing, please wait…
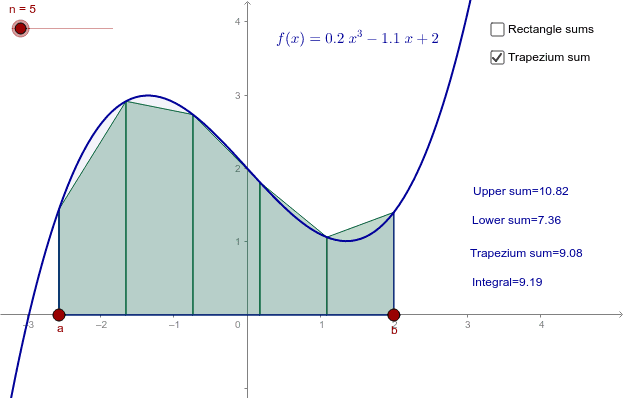
This example demonstrates the geometric interpretation of definite integrals through Riemann sums, visualizing the approximation process of upper sums, lower sums, and trapezoidal sums. Key math concepts include definite integrals, Riemann sums, upper and lower sums, trapezoidal sums, and function graphs. Constructed using GeoGebra commands like Point, UpperSum, LowerSum, TrapezoidalSum, Integral, and objects such as f (function), text1-5 (texts), A and B (interval endpoints), n (partition number), u and l (variables), t (temporary object), and a and b (parameters). Suitable for high school and above students learning calculus to intuitively understand the definition and computation of definite integrals.
GeoGebra Commands & Parameters
Point(xAxis) → APoint(xAxis) → BUpperSum(f, x(A), x(B), n) → uLowerSum(f, x(A), x(B), n) → lTrapezoidalSum(f, x(A), x(B), n) → tIntegral(f, x(A), x(B)) → int
AI Drawing Prompt Reference
Draw the graph of function f, and approximate the integral using upper sums, lower sums, and trapezoidal sums with n equal partitions in interval AB, also show the value of the definite integral.
The prompt above was compiled from the original drawing commands and is for reference only.