
Riemann Sums by Lenore Horner
Loading the math board and drawing, please wait…
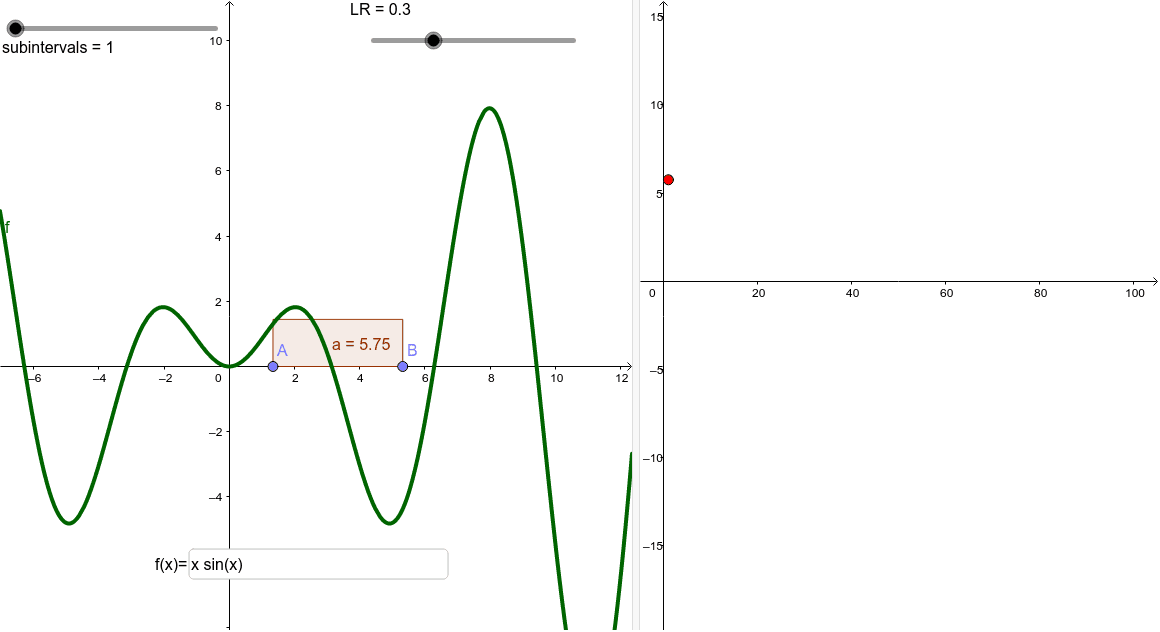
This example demonstrates how Riemann sums approximate the area under a function's graph, illustrating the concept of definite integrals. Key math concepts include Riemann sums, definite integrals, limits, function graphs, and subinterval partitioning. It is constructed using GeoGebra commands like Point, Textfield, and RectangleSum for subintervals, rectangles, and summation. Suitable for high school and above students learning calculus to understand the geometric interpretation and limit idea of definite integrals.
GeoGebra Commands & Parameters
Point(xAxis) → APoint(xAxis) → BTextfield(f) → InputBox1RectangleSum(f, x(A), x(B), subintervals, LR) → a
AI Drawing Prompt Reference
Draw a function graph and represent the Riemann sum with rectangles below it to show how rectangles approximate the area under the function graph, illustrating the concept of definite integrals. Mark two points on the x-axis as the start and end of the interval, input the function expression, and automatically generate several rectangles based on the input function and interval, then sum them to visually demonstrate the construction process of the Riemann sum and the geometric meaning of definite integrals.
The prompt above was compiled from the original drawing commands and is for reference only.