
Riemann Sum Model
Loading the math board and drawing, please wait…
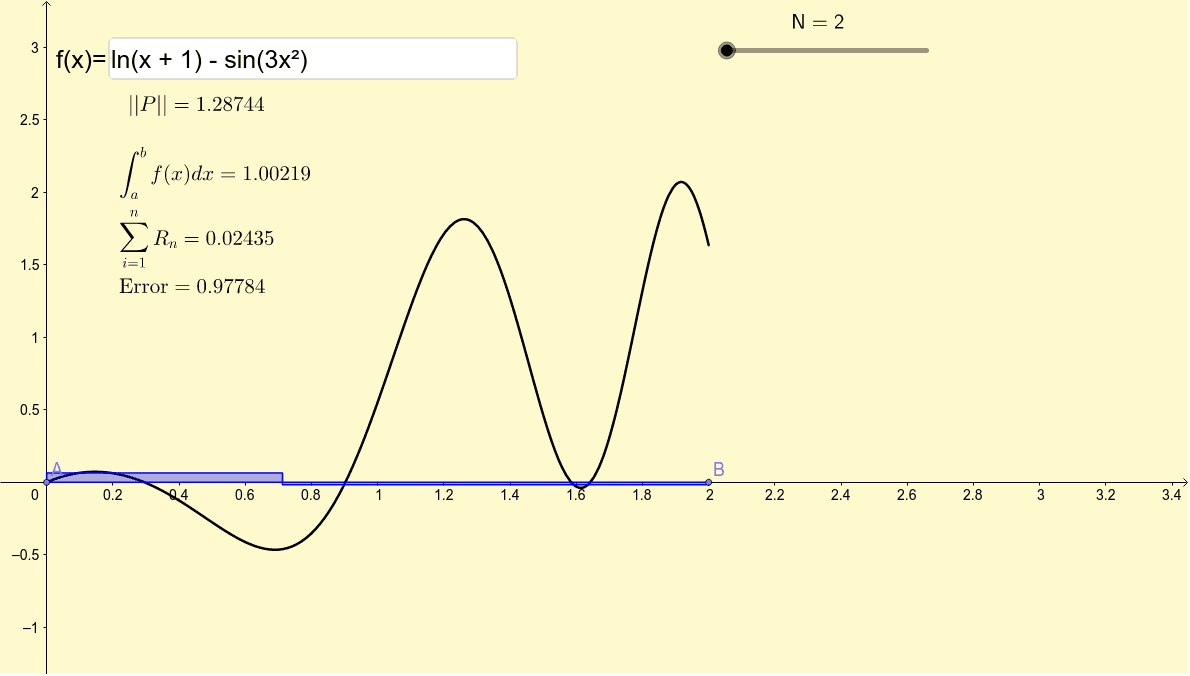
This model demonstrates the concept of Riemann sums, approximating the integral value by dynamically adjusting the number of segments. Key mathematical concepts include integration and stochastic processes. It uses commands like point, sequence, sort, sum, and integral in GeoGebra. Suitable for calculus education to help students understand the geometric meaning of integration.
GeoGebra Commands & Parameters
Point(xAxis) → BPoint(xAxis) → ASequence(RandomUniform[a, b], i, 1, N - 1) → randsSort(rands) → sortrandsSum(rands) → sumrandsTextfield(f_1) → inputBox1Append(Append[A, Sequence[(Element[sortrands, i], 0), i, 1, N - 1]], B) → partitionPSequence(f(RandomUniform[x(Element[partitionP, i]), x(Element[partitionP, i + 1])]), i, 1, N) → fx_iSequence((0, Element[fx_i, i]), i, 1, N) → fx_ipointlistSequence(Polygon[Element[partitionP, i], Element[partitionP, i] + Element[fx_ipointlist, i], Element[partitionP, i + 1] + Element[fx_ipointlist, i], Element[partitionP, i + 1]], i, 1, N) → polygonsIntegral(f, a, b) → integralSequence(If[Element[fx_i, i] > 0, Area[Element[polygons, i]], (-Area[Element[polygons, i]])], i, 1, N) → signedpolygonsSum(signedpolygons) → integralapproxMax(Sequence[x(Element[partitionP, i + 1]) - x(Element[partitionP, i]), i, 1, N]) → normP
AI Drawing Prompt Reference
Draw a model demonstrating the concept of Riemann sums, featuring two points on the x-axis, randomly generating N-1 numbers between a and b, sorting them, creating segments on the x-axis, and placing a rectangle on each segment with a random height. Sum the areas of all rectangles to approximate the integral, display the true integral value, and show the width of the segments to illustrate the geometric meaning of integration.
The prompt above was compiled from the original drawing commands and is for reference only.