
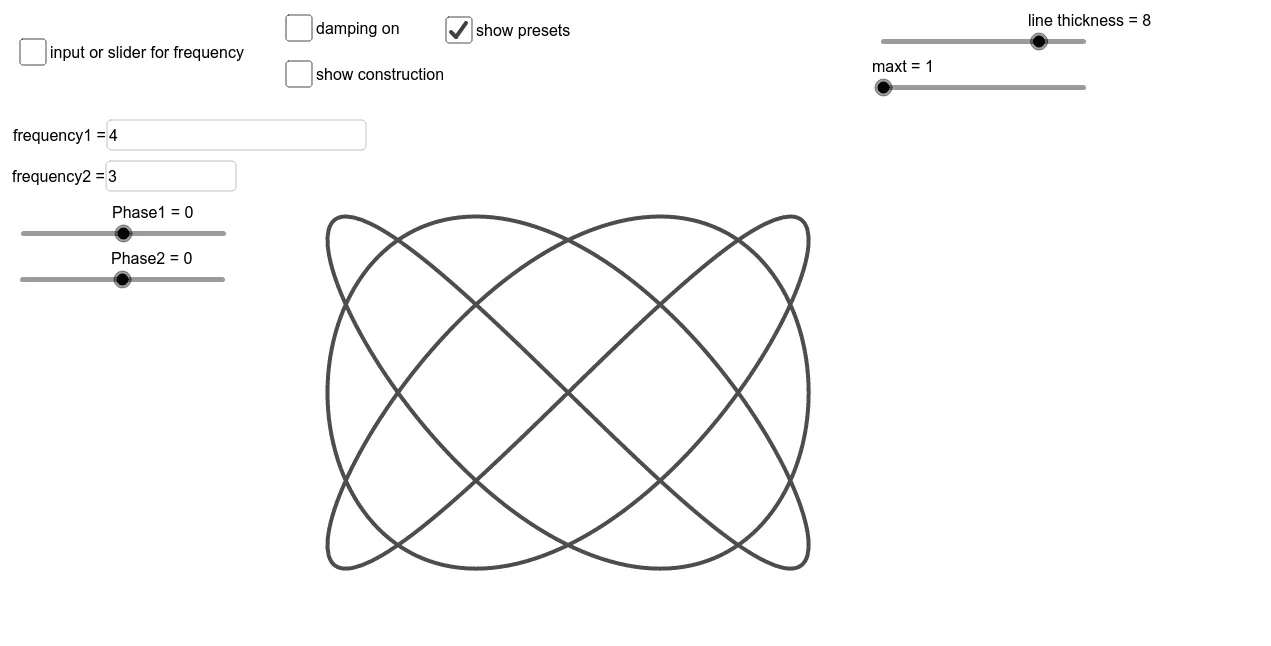
Visualize Two Note Harmonies with Lissajous Diagrams
Loading the math board and drawing, please wait…
This example uses Lissajous diagrams to visualize the harmony between two notes. It involves core concepts of trigonometry and coordinate geometry. Users can adjust the frequency, phase, and amplitude of the notes using GeoGebra commands like Segment, CurveCartesian, and Textfield, observing the changes in the Lissajous diagram. Suitable for high school mathematics education and learning.
GeoGebra Commands & Parameters
Segment(A, C) → fSegment(B, C) → gCurveCartesian(((Amplitude_x * sin((((2 * π) * frequency2) * s) + Phase2)) * ℯ^(If[b, ((-damping_x) * s), 0])), ((Amplitude_y * sin((((2 * π) * frequency1) * s) + Phase1)) * ℯ^(If[b, ((-damping_y) * s), 0])), s, 0, maxt) → aSegment((0, 1), (0, 3)) → hSegment((1, 0), (3, 0)) → iTextfield(freq2) → InputBox2Textfield(freq1) → InputBox1