
Visualize 3 Note Chords with Lissajous Diagrams in 3-D
Loading the math board and drawing, please wait…
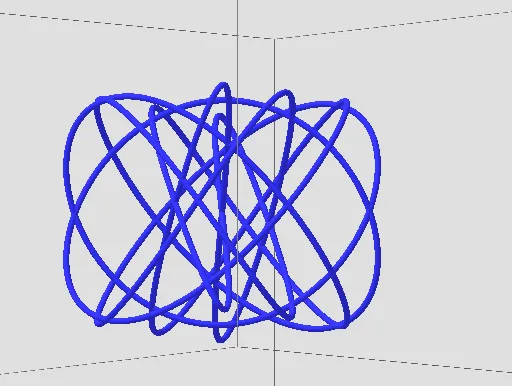
This example demonstrates the vibration patterns of 3-note chords using 3D Lissajous diagrams. Key math concepts include 3D coordinate geometry, trigonometry, parametric equations, and vibration theory. Constructed using commands like Textfield and CurveCartesian, controlling parameters such as amplitude, frequency, phase, and damping. Suitable for high school students and learners interested in sound synthesis and mathematical visualization.
GeoGebra Commands & Parameters
Textfield(freq3) → InputBox4Textfield(freq2) → InputBox1Textfield(freq1) → InputBox2CurveCartesian(((amplitude1 * sin((((2 * π) * frequency1) * s) + phase1)) * ℯ^(If[b, ((-damping1) * s), 0])), ((amplitude2 * sin((((2 * π) * frequency2) * s) + phase2)) * ℯ^(If[b, ((-damping2) * s), 0])), ((amplitude3 * sin((((2 * π) * frequency3) * s) + phase3)) * ℯ^(If[b, ((-damping3) * s), 0])), s, 0, maxt) → a