
Riemann Sphere for Asymptotic Graphs
Loading the math board and drawing, please wait…
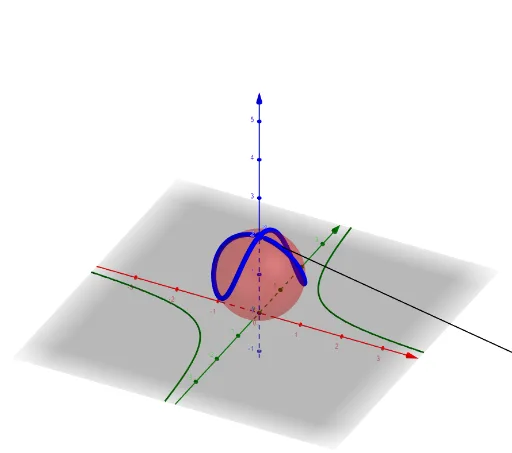
This example demonstrates the application of the Riemann Sphere in asymptotic graphs, visually illustrating the one-to-one correspondence between the complex plane and the sphere. Key mathematical concepts include complex numbers, limits, spherical geometry, and asymptotes. The construction utilizes GeoGebra commands and objects such as Sphere, Segment, Intersect, and Textfield. Suitable for high school and above students to understand the Riemann Sphere model in complex analysis and its geometric significance.
GeoGebra Commands & Parameters
Sphere((0, 0, 1), 1) → aSegment(A, B) → gIntersect(g, a) → C, DTextfield(f) → InputBox1
AI Drawing Prompt Reference
Draw a unit sphere centered at (0,0,1) with radius 1. Select two points outside or inside the sphere and connect them with a line segment, which intersects the sphere at two points. Place a text input box nearby for entering or displaying a function expression. The overall scene illustrates the Riemann sphere model, showing the correspondence between the complex plane and the sphere, with relevance to asymptotic behavior.
The prompt above was compiled from the original drawing commands and is for reference only.