
Goals per game in the Premier League - Poisson Distribution
Loading the math board and drawing, please wait…
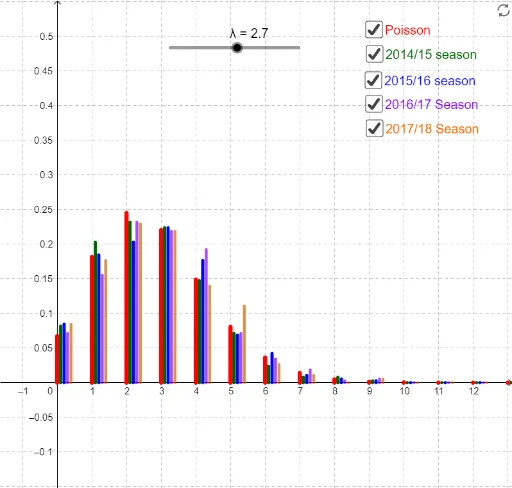
This example demonstrates the Poisson distribution model for goals per game in the Premier League, visually showing how the probability of goals changes with the mean λ. Key math concepts include Poisson distribution, probability & statistics, function graphing, bar chart, and tangent line. GeoGebra commands used are Normal and Segment, with objects like λ (parameter), f, g (functions), and points a-g, B1-A17 (auxiliary), C3-C15 (locus). Suitable for high school and above, helping learners understand the connection between discrete and continuous distributions and the impact of parameters on distribution shape.
GeoGebra Commands & Parameters
Normal(λ, sqrt(λ), x, false) → gSegment((1, 0), (1, f(1))) → aSegment((2, 0), (2, f(2))) → bSegment((3, 0), (3, f(3))) → cSegment((4, 0), (4, f(4))) → dSegment((5, 0), (5, f(5))) → eSegment((6, 0), (6, f(6))) → hSegment((A2, 0), (A2, f(A2))) → C2Segment((A3, 0), (A3, f(A3))) → C3Segment((A4, 0), (A4, f(A4))) → C4Segment((A5, 0), (A5, f(A5))) → C5Segment((A6, 0), (A6, f(A6))) → C6Segment((A7, 0), (A7, f(A7))) → C7Segment((A8, 0), (A8, f(A8))) → C8Segment((A9, 0), (A9, f(A9))) → C9Segment((A10, 0), (A10, f(A10))) → C10Segment((A11, 0), (A11, f(A11))) → C11Segment((A12, 0), (A12, f(A12))) → C12Segment((A13, 0), (A13, f(A13))) → C13Segment((A14, 0), (A14, f(A14))) → C14Segment((A15, 0), (A15, f(A15))) → C15Segment((A16, 0), (A16, f(A16))) → C16Segment((A17, 0), (A17, f(A17))) → C17Segment((A18, 0), (A18, f(A18))) → C18Segment((A19, 0), (A19, f(A19))) → C19Segment((A20, 0), (A20, f(A20))) → C20Segment((A21, 0), (A21, f(A21))) → C21Segment((A22, 0), (A22, f(A22))) → C22Segment((A23, 0), (A23, f(A23))) → C23Segment((A24, 0), (A24, f(A24))) → C24Segment((A25, 0), (A25, f(A25))) → C25Segment((A26, 0), (A26, f(A26))) → C26Segment((A27, 0), (A27, f(A27))) → C27Segment((A28, 0), (A28, f(A28))) → C28Segment((A29, 0), (A29, f(A29))) → C29Segment((A30, 0), (A30, f(A30))) → C30Segment((A31, 0), (A31, f(A31))) → C31Segment((A2 + 0.2, 0), (A2 + 0.2, E2)) → F2Segment((A3 + 0.2, 0), (A3 + 0.2, E3)) → F3Segment((A4 + 0.2, 0), (A4 + 0.2, E4)) → F4Segment((A5 + 0.2, 0), (A5 + 0.2, E5)) → F5Segment((A6 + 0.2, 0), (A6 + 0.2, E6)) → F6Segment((A7 + 0.2, 0), (A7 + 0.2, E7)) → F7Segment((A8 + 0.2, 0), (A8 + 0.2, E8)) → F8Segment((A9 + 0.2, 0), (A9 + 0.2, E9)) → F9Segment((A10 + 0.2, 0), (A10 + 0.2, E10)) → F10Segment((A11 + 0.2, 0), (A11 + 0.2, E11)) → F11Segment((A12 + 0.2, 0), (A12 + 0.2, E12)) → F12Segment((A13 + 0.2, 0), (A13 + 0.2, E13)) → F13Segment((A14 + 0.2, 0), (A14 + 0.2, E14)) → F14Segment((A15 + 0.2, 0), (A15 + 0.2, E15)) → F15Segment((A2 + 0.1, 0), (A2 + 0.1, H2)) → I2Segment((A3 + 0.1, 0), (A3 + 0.1, H3)) → I3Segment((A4 + 0.1, 0), (A4 + 0.1, H4)) → I4Segment((A5 + 0.1, 0), (A5 + 0.1, H5)) → I5Segment((A6 + 0.1, 0), (A6 + 0.1, H6)) → I6Segment((A7 + 0.1, 0), (A7 + 0.1, H7)) → I7Segment((A8 + 0.1, 0), (A8 + 0.1, H8)) → I8Segment((A9 + 0.1, 0), (A9 + 0.1, H9)) → I9Segment((A10 + 0.1, 0), (A10 + 0.1, H10)) → I10Segment((A11 + 0.1, 0), (A11 + 0.1, H11)) → I11Segment((A12 + 0.1, 0), (A12 + 0.1, H12)) → I12Segment((A13 + 0.1, 0), (A13 + 0.1, H13)) → I13Segment((A14 + 0.1, 0), (A14 + 0.1, H14)) → I14Segment((A15 + 0.1, 0), (A15 + 0.1, H15)) → I15Segment((A2 + 0.3, 0), (A2 + 0.3, E19)) → F19Segment((A3 + 0.3, 0), (A3 + 0.3, E20)) → F20Segment((A4 + 0.3, 0), (A4 + 0.3, E21)) → F21Segment((A5 + 0.3, 0), (A5 + 0.3, E22)) → F22Segment((A6 + 0.3, 0), (A6 + 0.3, E23)) → F23Segment((A7 + 0.3, 0), (A7 + 0.3, E24)) → F24Segment((A8 + 0.3, 0), (A8 + 0.3, E25)) → F25Segment((A9 + 0.3, 0), (A9 + 0.3, E26)) → F26Segment((A10 + 0.3, 0), (A10 + 0.3, E27)) → F27Segment((A11 + 0.3, 0), (A11 + 0.3, E28)) → F28Segment((A12 + 0.3, 0), (A12 + 0.3, E29)) → F29Segment((A13 + 0.3, 0), (A13 + 0.3, E30)) → F30Segment((A14 + 0.3, 0), (A14 + 0.3, E31)) → F31Segment((A15 + 0.3, 0), (A15 + 0.3, E32)) → F32Segment((A2 + 0.4, 0), (A2 + 0.4, H19)) → I19Segment((A3 + 0.4, 0), (A3 + 0.4, H20)) → I20Segment((A4 + 0.4, 0), (A4 + 0.4, H21)) → I21Segment((A5 + 0.4, 0), (A5 + 0.4, H22)) → I22Segment((A6 + 0.4, 0), (A6 + 0.4, H23)) → I23Segment((A7 + 0.4, 0), (A7 + 0.4, H24)) → I24Segment((A8 + 0.4, 0), (A8 + 0.4, H25)) → I25Segment((A9 + 0.4, 0), (A9 + 0.4, H26)) → I26Segment((A10 + 0.4, 0), (A10 + 0.4, H27)) → I27Segment((A11 + 0.4, 0), (A11 + 0.4, H28)) → I28Segment((A12 + 0.4, 0), (A12 + 0.4, H29)) → I29Segment((A13 + 0.4, 0), (A13 + 0.4, H30)) → I30Segment((A14 + 0.4, 0), (A14 + 0.4, H31)) → I31Segment((A15 + 0.4, 0), (A15 + 0.4, H32)) → I32
AI Drawing Prompt Reference
Draw a Poisson distribution function graph showing the probability distribution of goals per game in the Premier League. Set parameter λ and draw function g to represent the Poisson distribution. Draw 6 vertical segments on the x-axis from 1 to 6, each corresponding to an integer x value, with lengths equal to f(x). Then, draw 25 vertical segments on the x-axis from 7 to 31, each corresponding to an x value, with lengths equal to f(x). Finally, draw two horizontal segments parallel to the x-axis at x=1.2 and x=2.2, with lengths equal to f(1) and f(2).
The prompt above was compiled from the original drawing commands and is for reference only.